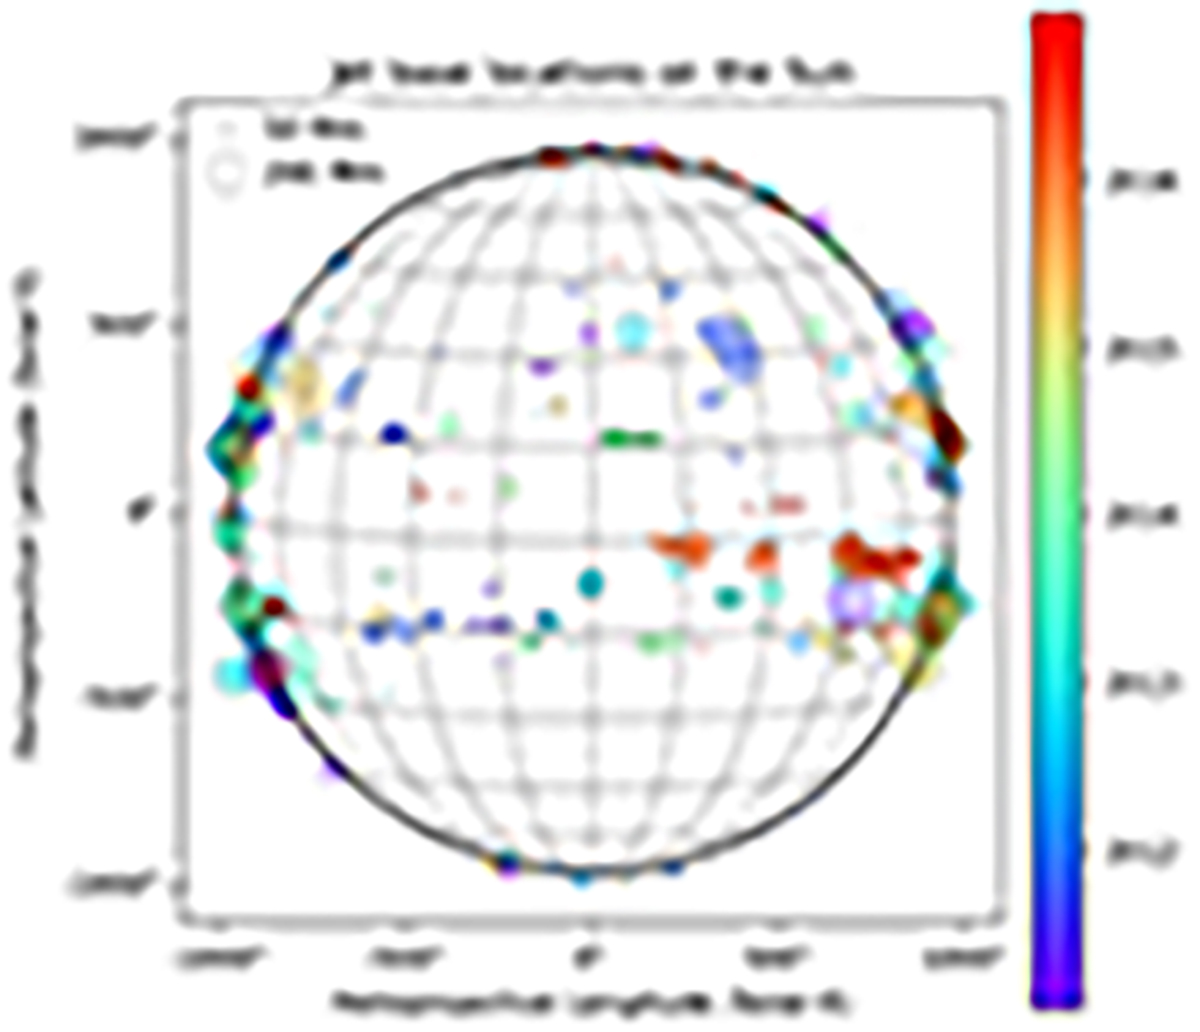
Fig. 9.
Download original image
Base point locations of the 883 jet clusters between the years 2011 to 2016. The vertical and horizontal axis show the helioprojective X and Y coordinates, respectively. For each jet cluster, the color of the symbol represents the date of the event and the size of the circle is proportional to the spatial extent (height of the average box) of the event.
Current usage metrics show cumulative count of Article Views (full-text article views including HTML views, PDF and ePub downloads, according to the available data) and Abstracts Views on Vision4Press platform.
Data correspond to usage on the plateform after 2015. The current usage metrics is available 48-96 hours after online publication and is updated daily on week days.
Initial download of the metrics may take a while.