Open Access
Fig. 5.
Download original image
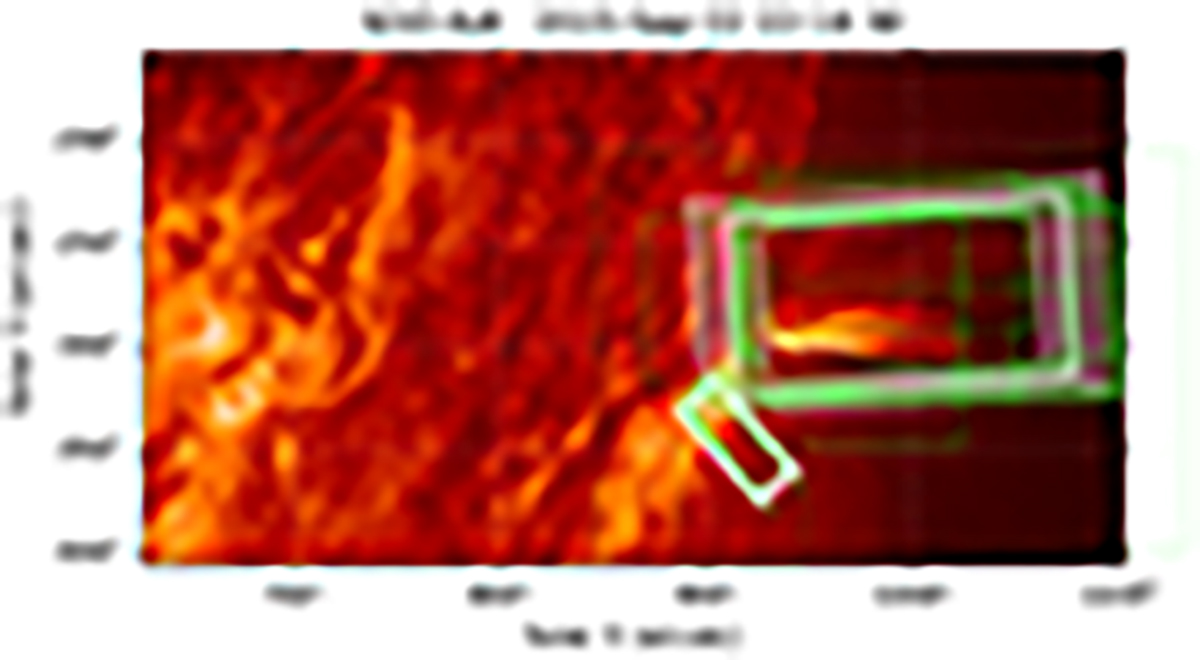
Example of the clustering of volunteer annotations into an aggregate result. The green boxes correspond to the volunteer annotations and the white boxes show the corresponding “average”. The white shaded region denotes the 1σ uncertainty in each average box.
Current usage metrics show cumulative count of Article Views (full-text article views including HTML views, PDF and ePub downloads, according to the available data) and Abstracts Views on Vision4Press platform.
Data correspond to usage on the plateform after 2015. The current usage metrics is available 48-96 hours after online publication and is updated daily on week days.
Initial download of the metrics may take a while.