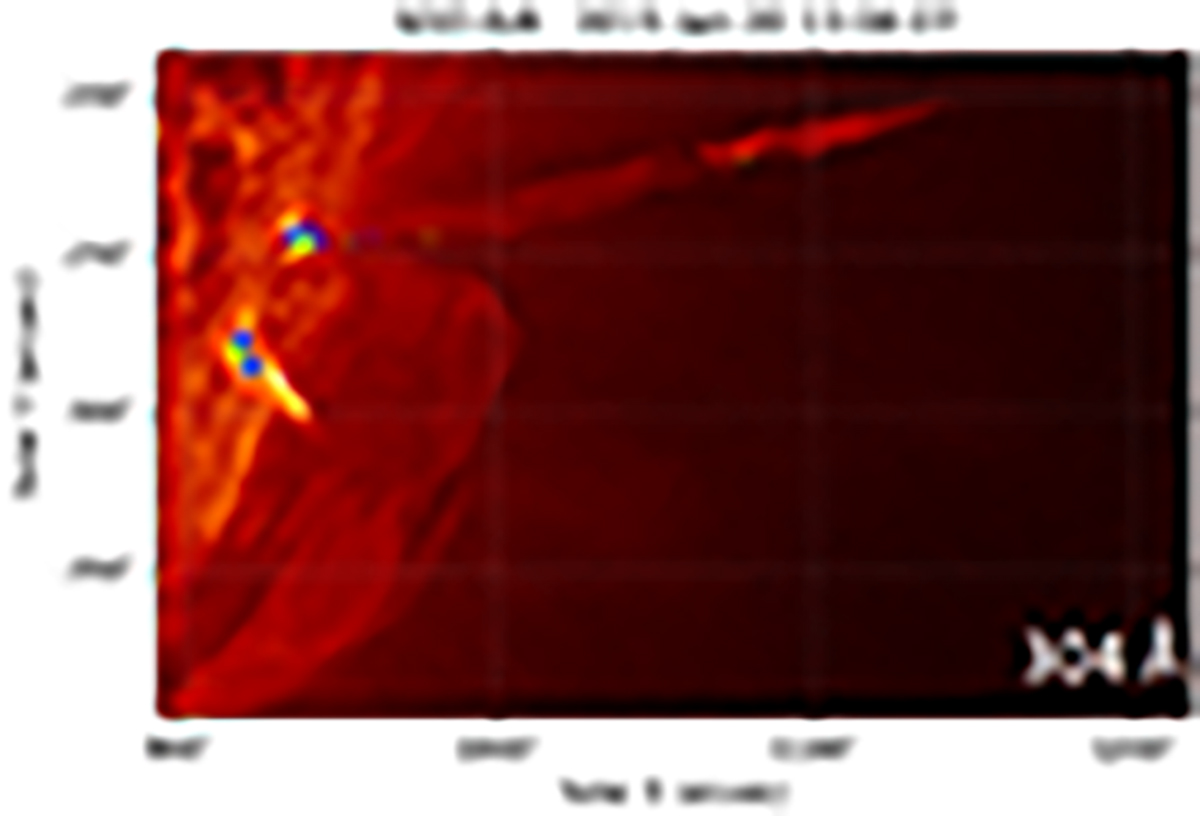
Fig. 4.
Download original image
Point clustering for a subject. The blue points are the volunteer annotation of the base of the jet when it starts and the yellow points are the base of the jet when it ends. The blue and the yellow crosses are the corresponding aggregated cluster centers, and the circles denote the 1σ error in the location of the cluster center.
Current usage metrics show cumulative count of Article Views (full-text article views including HTML views, PDF and ePub downloads, according to the available data) and Abstracts Views on Vision4Press platform.
Data correspond to usage on the plateform after 2015. The current usage metrics is available 48-96 hours after online publication and is updated daily on week days.
Initial download of the metrics may take a while.