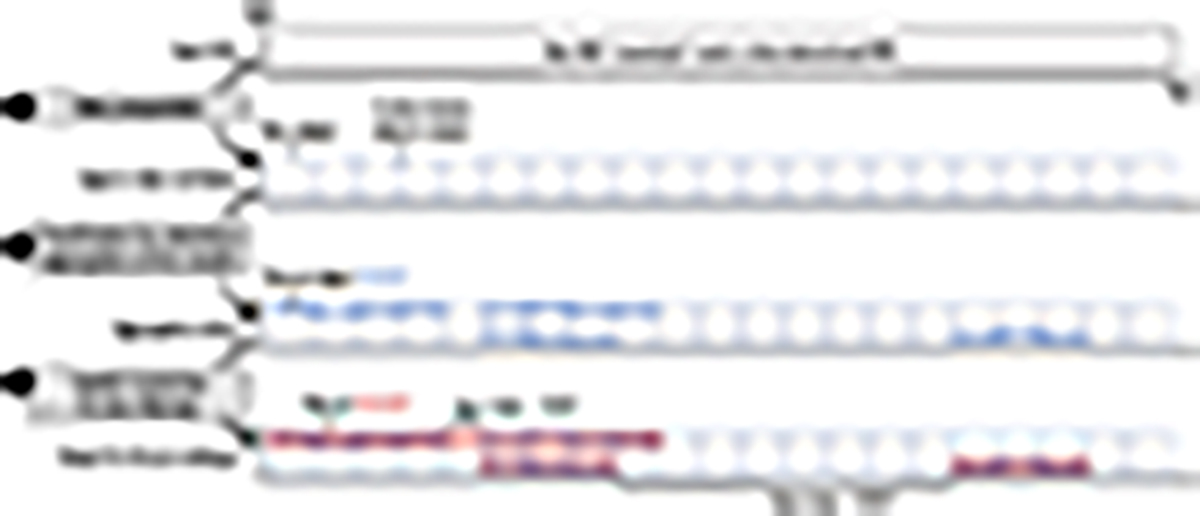
Fig. 1.
Download original image
Diagram describing the relation between HEK events, Zooniverse subjects, jet clusters, and jets. The input data is a HEK event that may contain one or several jets. The time interval of the HEK event is cut into smaller time intervals to form Zooniverse subjects (see Sect. 2.1 for more details). There is an overlap of two frames between two adjacent subjects. After classification and aggregation of the results from the Solar Jet Hunter (as described in Sect. 3.1), for each subject, we have a list of jet objects discovered by the volunteers. Many subjects do not contain any jet object, some subjects contain more than one jet object. Then, for all the subjects of the original HEK event, the jet objects are clustered in space and time (as described in Sect. 3.3). In this diagram, the output is three jets, two of them overlapping in time, and two of them happening one after another at the same position.
Current usage metrics show cumulative count of Article Views (full-text article views including HTML views, PDF and ePub downloads, according to the available data) and Abstracts Views on Vision4Press platform.
Data correspond to usage on the plateform after 2015. The current usage metrics is available 48-96 hours after online publication and is updated daily on week days.
Initial download of the metrics may take a while.