Open Access
Fig. E.3
Download original image
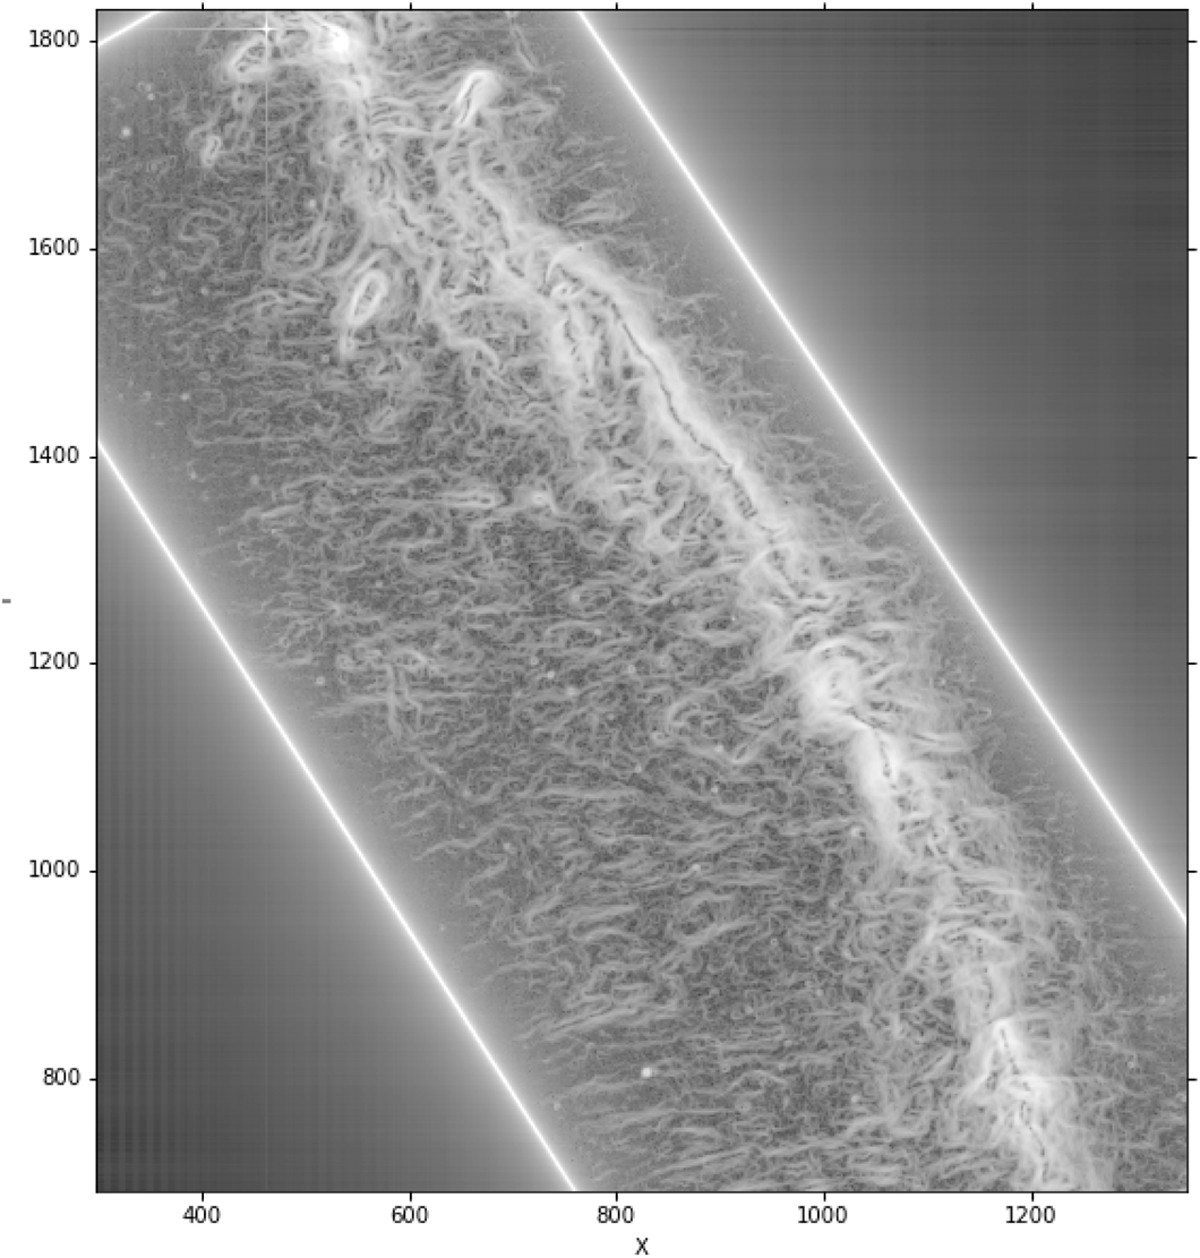
Visualization of the log of gradient norms on the Herschel observation map of Musca, after noise reduction with p = 1.5, q = −1, λ = 0.1. Although the log of gradient norms enhances the striations, the resulting spectrum, shown in figure E.2, is very different from the one obtained with the correlation measure.
Current usage metrics show cumulative count of Article Views (full-text article views including HTML views, PDF and ePub downloads, according to the available data) and Abstracts Views on Vision4Press platform.
Data correspond to usage on the plateform after 2015. The current usage metrics is available 48-96 hours after online publication and is updated daily on week days.
Initial download of the metrics may take a while.