Fig. D.1
Download original image
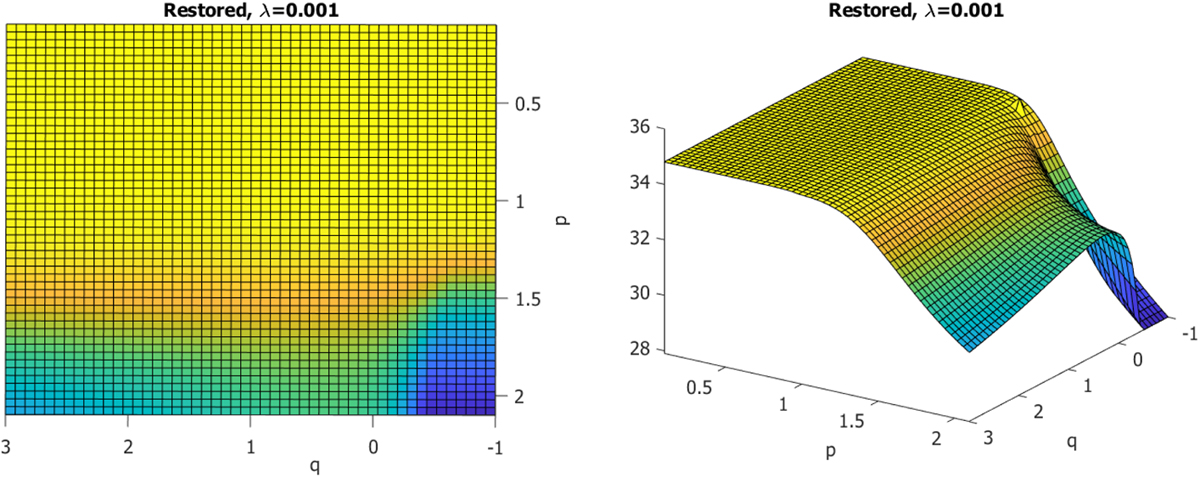
Surface of PSNR values as a function of p and q after deconvolution using the regularizer ![]() . The data file is a MHD simulation output as described in section 4. In the experiment, the beam effect H is the beam kernel defined in section 4. The lambda parameter is λ = 10−3. For a discrete set of (p, q) values in the range [0, 2] × [−1, 3] (50 equally spaced points on each axis)), we draw a color point representing the PSNR between the original (with no beam) image and the reconstructed one after applying the optimization process eq. 8. The higher the PSNR, the better the reconstruction. Left and right panels show respectively a 2D (orthographic) top view and a 3D view of the PSNR surface.
. The data file is a MHD simulation output as described in section 4. In the experiment, the beam effect H is the beam kernel defined in section 4. The lambda parameter is λ = 10−3. For a discrete set of (p, q) values in the range [0, 2] × [−1, 3] (50 equally spaced points on each axis)), we draw a color point representing the PSNR between the original (with no beam) image and the reconstructed one after applying the optimization process eq. 8. The higher the PSNR, the better the reconstruction. Left and right panels show respectively a 2D (orthographic) top view and a 3D view of the PSNR surface.
Current usage metrics show cumulative count of Article Views (full-text article views including HTML views, PDF and ePub downloads, according to the available data) and Abstracts Views on Vision4Press platform.
Data correspond to usage on the plateform after 2015. The current usage metrics is available 48-96 hours after online publication and is updated daily on week days.
Initial download of the metrics may take a while.