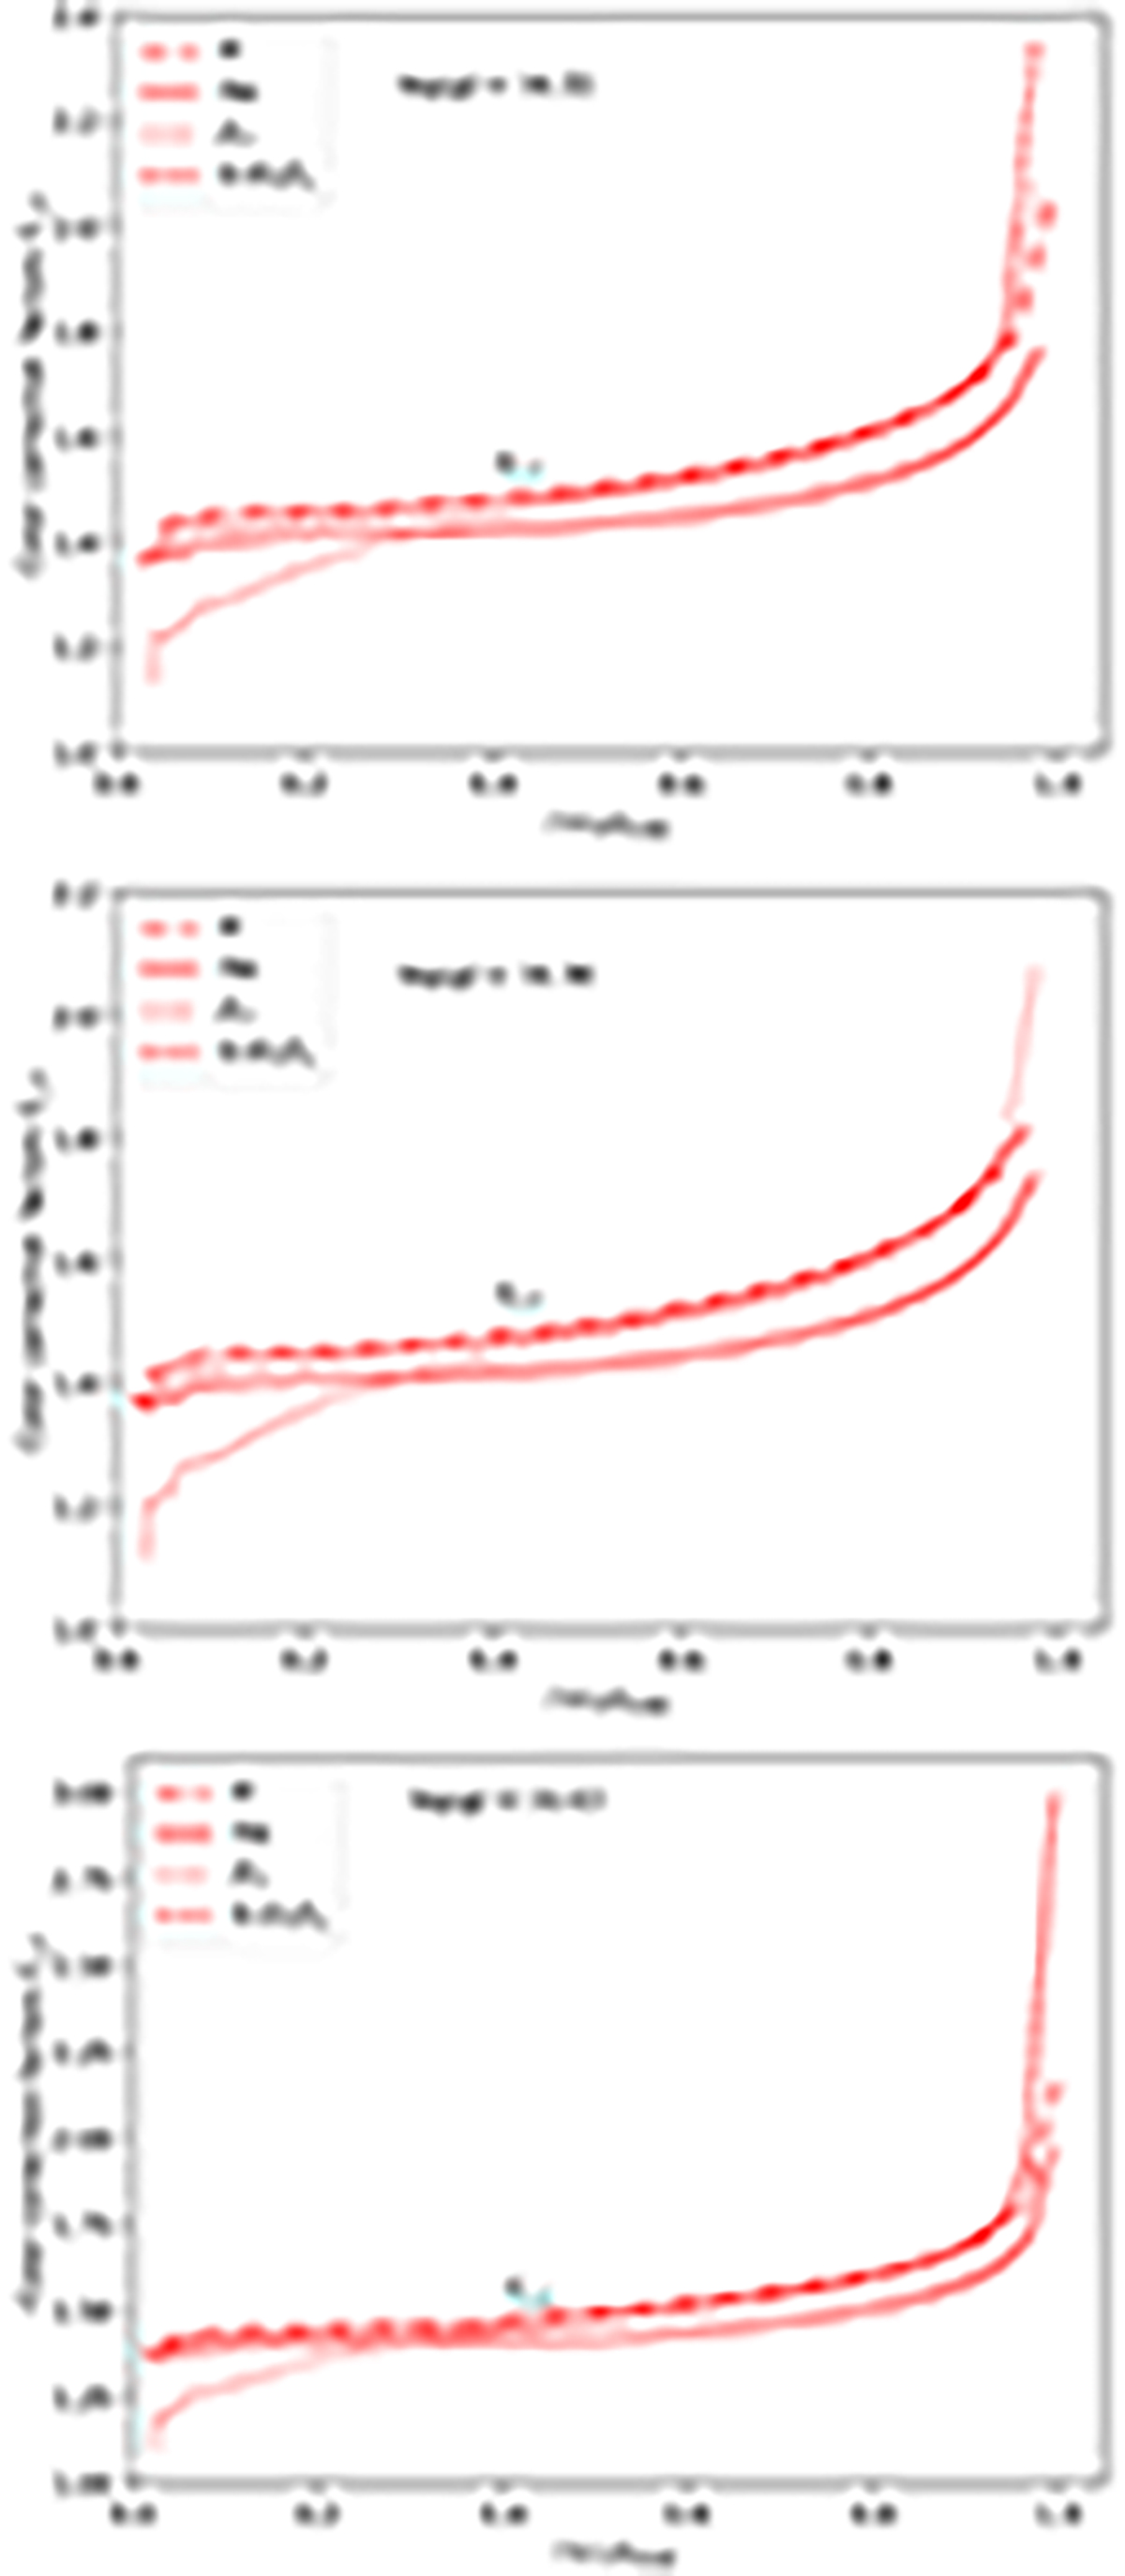
Fig. 8.
Download original image
Color-correction factors for local models fc, 2, obtained with the fitting procedure described in Sect. 3.2. The plots show the luminosity dependence for a fixed value of the surface gravity log(g) = 14.22 (top panel), log(g) = 14.34 (middle panel), and log(g) = 14.43 (bottom panel), i.e., the values inferred from the NS model (see Fig. 2), and for all chemical compositions.
Current usage metrics show cumulative count of Article Views (full-text article views including HTML views, PDF and ePub downloads, according to the available data) and Abstracts Views on Vision4Press platform.
Data correspond to usage on the plateform after 2015. The current usage metrics is available 48-96 hours after online publication and is updated daily on week days.
Initial download of the metrics may take a while.