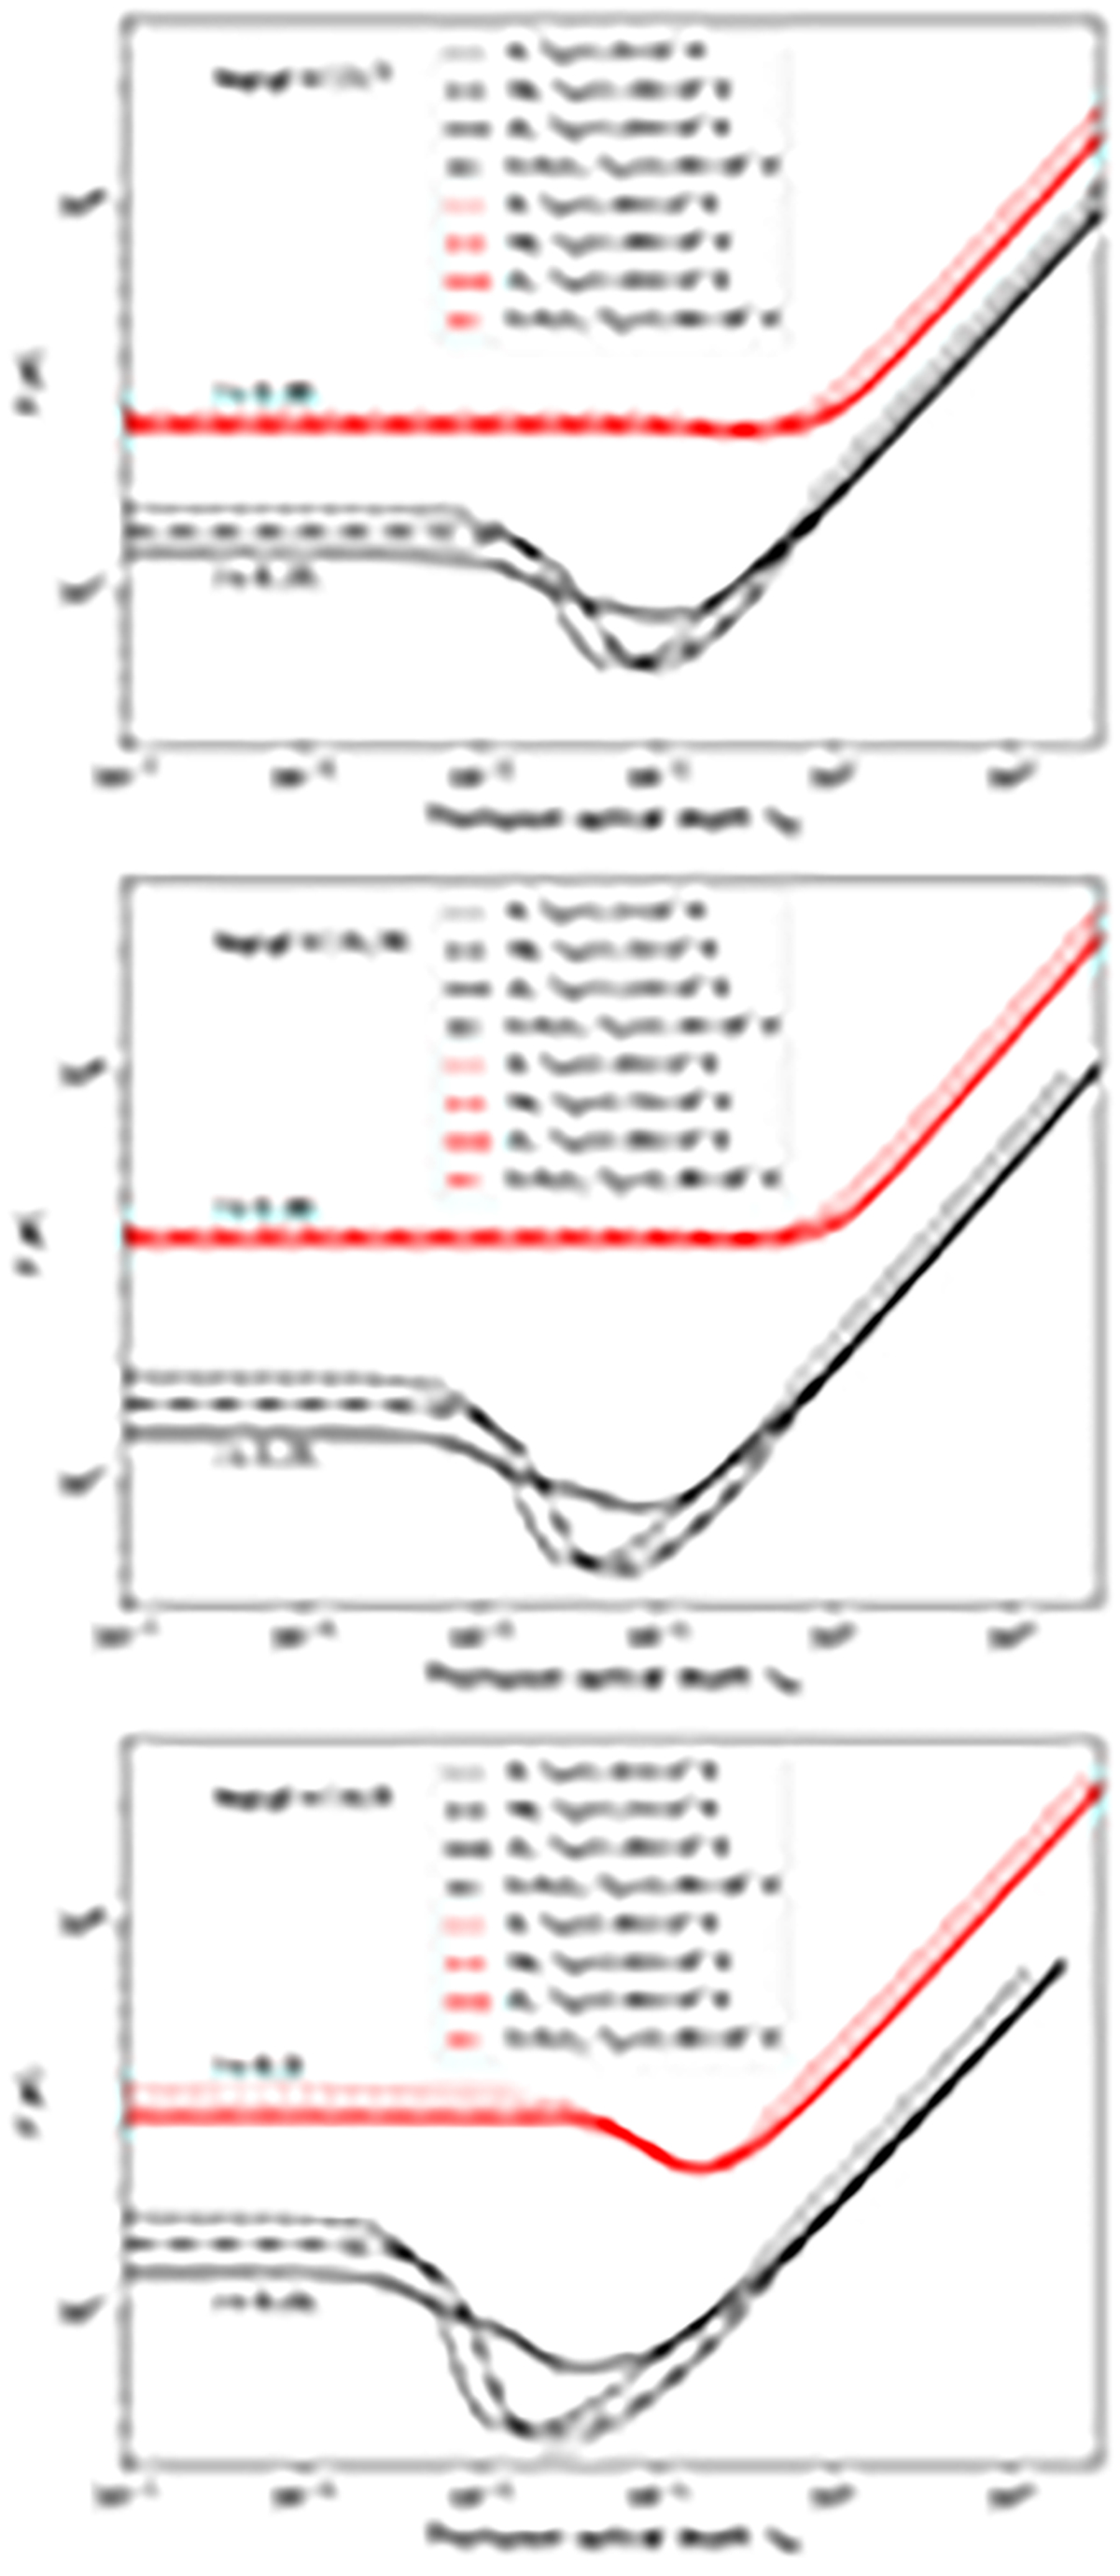
Fig. 4.
Download original image
Temperature structure for models with a fixed surface gravity equal to the measured value log(g) = 14.34, which corresponds to an NS mass 1.9 M⊙ and a radius of 12.4 km (middle panel; Nättilä et al. 2017), and the errors are log(g) = 13.70 (upper panel), and log(g) = 14.90 (bottom panel). The different chemical compositions are presented by different line styles given in the legend. Two relative luminosities are presented by red lines for l = 0.95 in the upper and middle panels, for l = 0.3 in the bottom panel, and by the black lines for l = 0.05, l = 0.13, l = 0.65 in the upper, middle, and bottom panel, respectively.
Current usage metrics show cumulative count of Article Views (full-text article views including HTML views, PDF and ePub downloads, according to the available data) and Abstracts Views on Vision4Press platform.
Data correspond to usage on the plateform after 2015. The current usage metrics is available 48-96 hours after online publication and is updated daily on week days.
Initial download of the metrics may take a while.