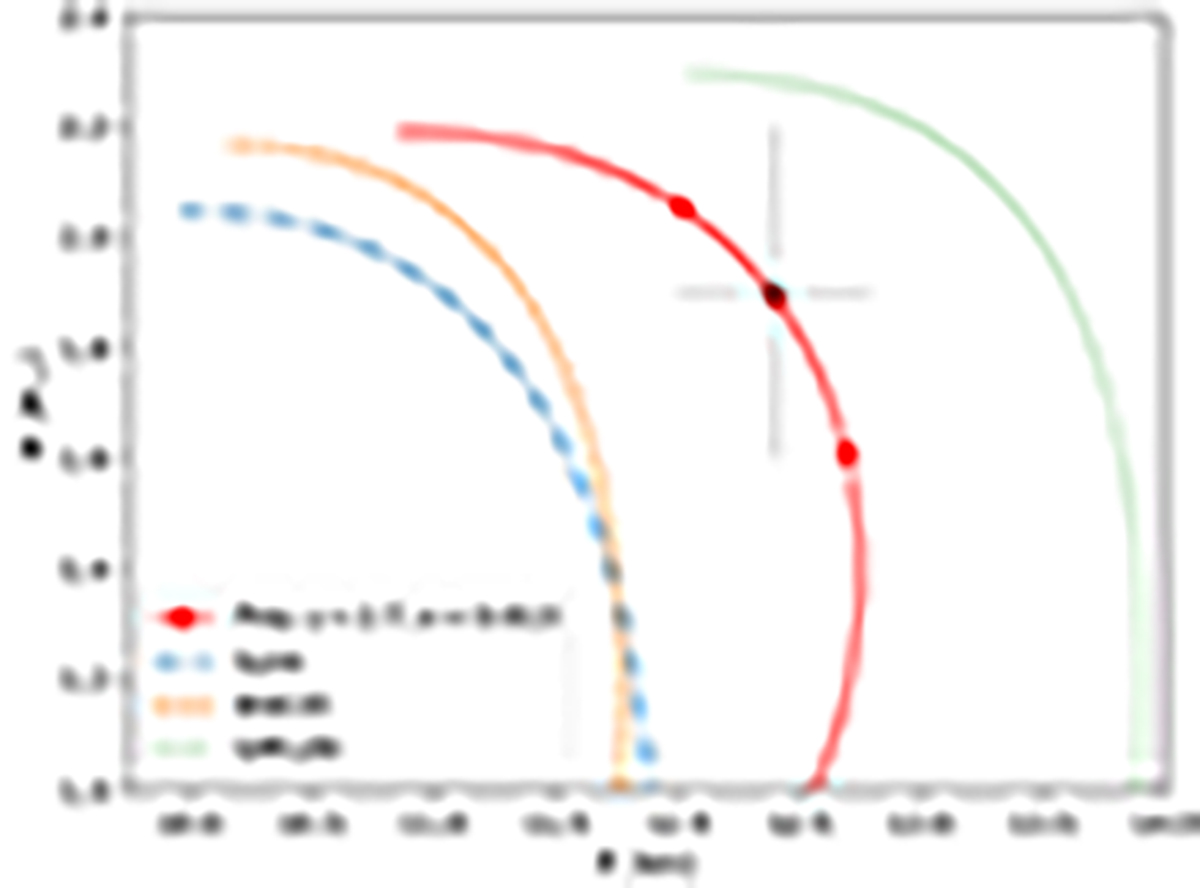
Fig. 2.
Download original image
NS mass-radius relations for selected EoSs. The dash-dotted blue curve presentes the SLY4 EOS, the dashed yellow curve shows the BSK20 EoS, and the dotted green curve shows GM1Z0 EoS. The red curve denotes the relativistic polytropic EoS consistent with the measurements of Nättilä et al. (2017), with dots marking the center of the error box and its boundaries.
Current usage metrics show cumulative count of Article Views (full-text article views including HTML views, PDF and ePub downloads, according to the available data) and Abstracts Views on Vision4Press platform.
Data correspond to usage on the plateform after 2015. The current usage metrics is available 48-96 hours after online publication and is updated daily on week days.
Initial download of the metrics may take a while.