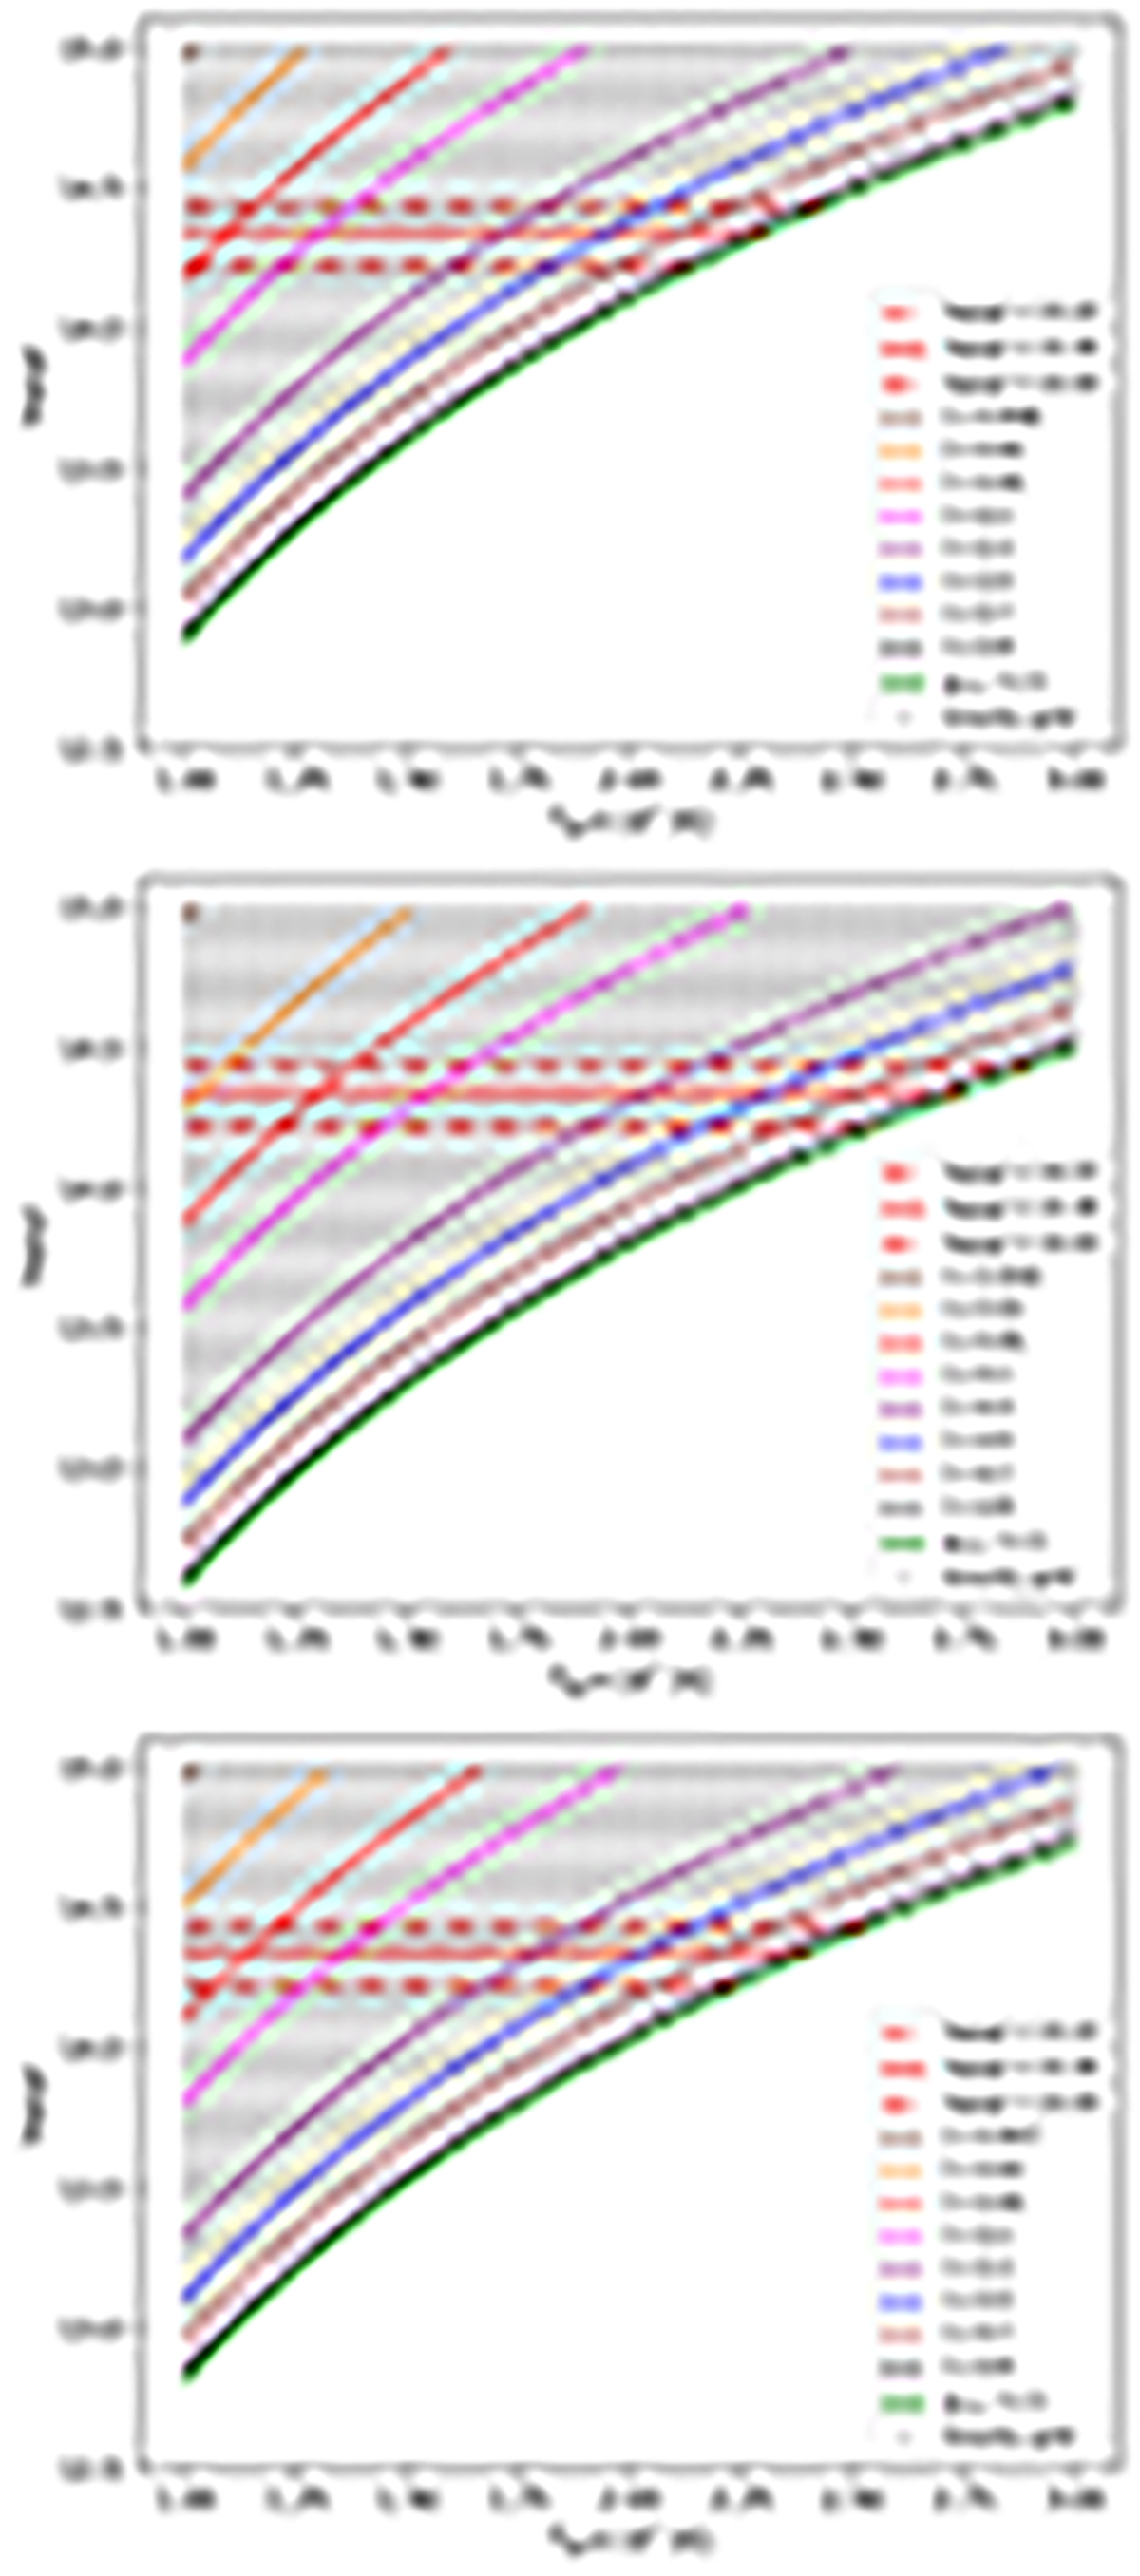
Fig. 1.
Download original image
Temperature – gravity grid for atmospheres composed purely of hydrogen (upper panel), purely of helium (middle panel), and of heavy elements (bottom panel). The gray dots show the gravity grid with Δg = 0.05 in logarithmic scale, because for Δg = 0.01, the figure would not be legible. The different dashed curves represent models with constant l at the values described in the legend. The horizontal solid red line displays the value of the gravity for the best-fit mass and radius measured by Nättilä et al. (2017), and the two horizontal dashed red lines correspond to the measured errors (see Sect. 2.3).
Current usage metrics show cumulative count of Article Views (full-text article views including HTML views, PDF and ePub downloads, according to the available data) and Abstracts Views on Vision4Press platform.
Data correspond to usage on the plateform after 2015. The current usage metrics is available 48-96 hours after online publication and is updated daily on week days.
Initial download of the metrics may take a while.