Open Access
Fig. 8
Download original image
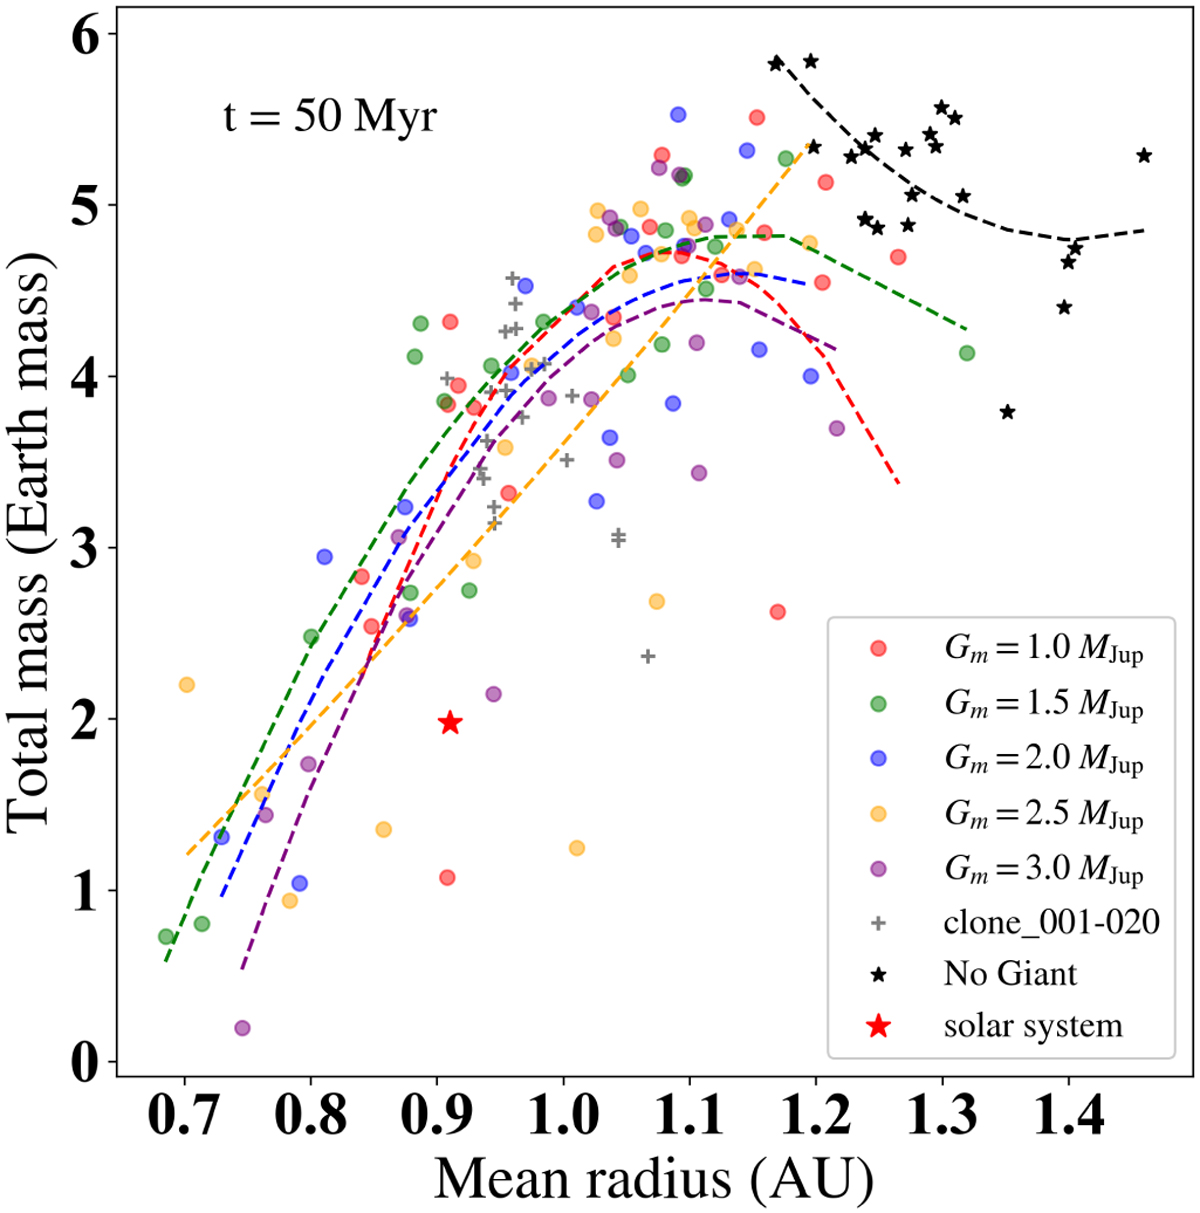
Total mass of terrestrial planets as a function of the mean orbit for all simulation samples. The black stars represent the “no giant” group and the red star represents the Solar System. The figure indicates that simulations setups containing a gas giant and those without gas giants fall into two distinct groups.
Current usage metrics show cumulative count of Article Views (full-text article views including HTML views, PDF and ePub downloads, according to the available data) and Abstracts Views on Vision4Press platform.
Data correspond to usage on the plateform after 2015. The current usage metrics is available 48-96 hours after online publication and is updated daily on week days.
Initial download of the metrics may take a while.