Open Access
Fig. 2
Download original image
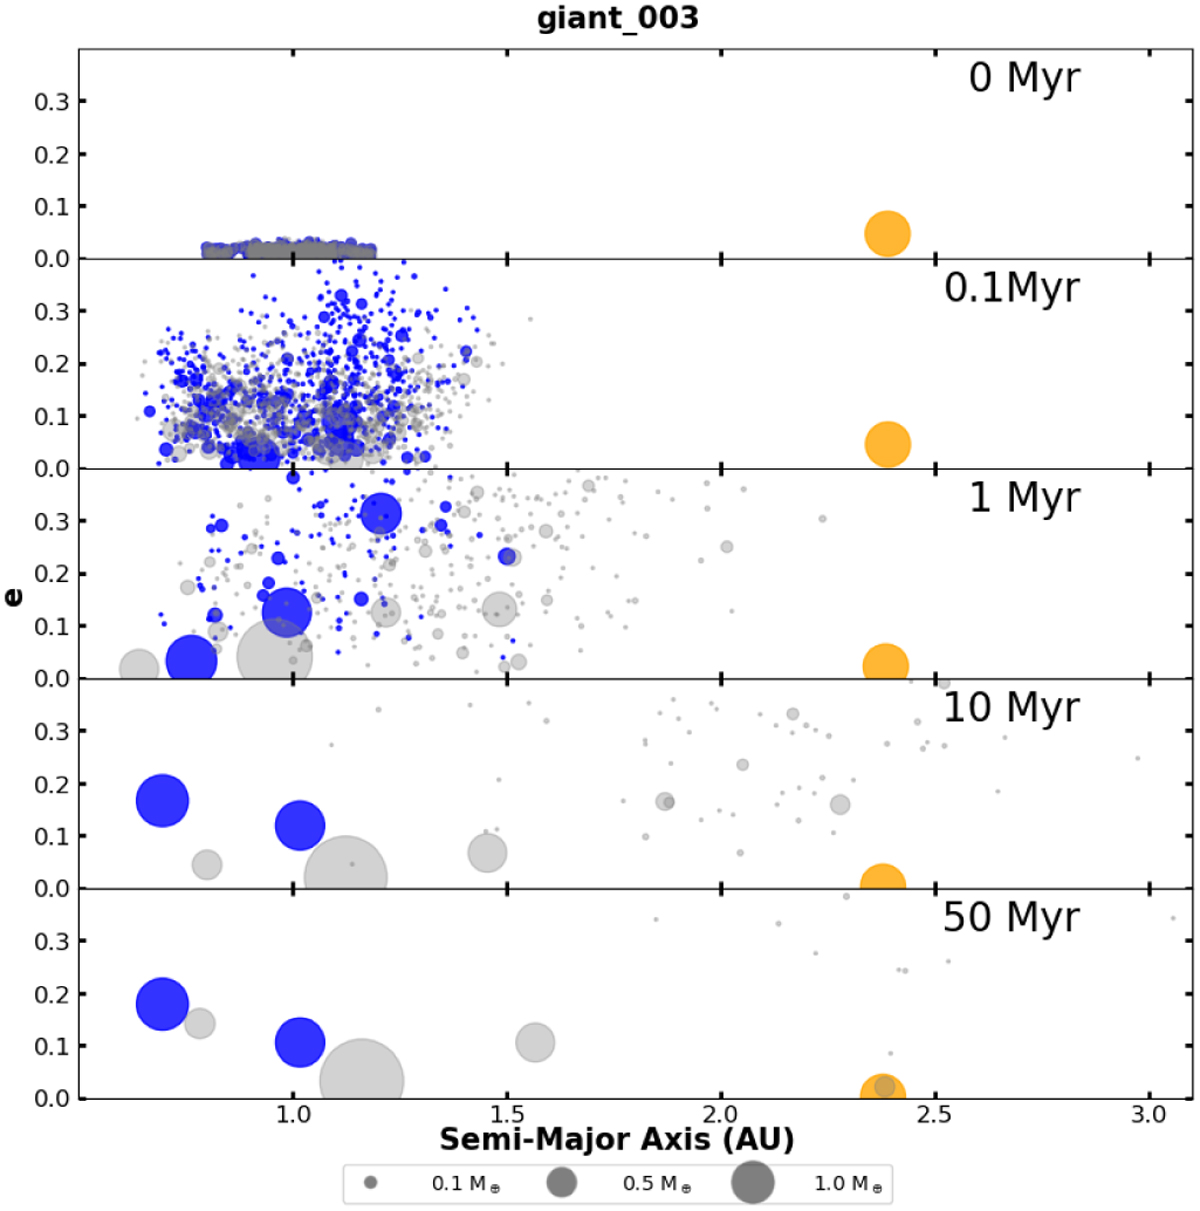
Snapshots of terrestrial planet evolution. The orange dot denotes a gas giant with a mass of 1.0 MJup. The blue dots trace the evolution of planetesimals and planetary embryos. Grey dots are used as a background to illustrate the evolutionary paths of terrestrial planets in the absence of a gas giant’s perturbation.
Current usage metrics show cumulative count of Article Views (full-text article views including HTML views, PDF and ePub downloads, according to the available data) and Abstracts Views on Vision4Press platform.
Data correspond to usage on the plateform after 2015. The current usage metrics is available 48-96 hours after online publication and is updated daily on week days.
Initial download of the metrics may take a while.