Fig. 12
Download original image
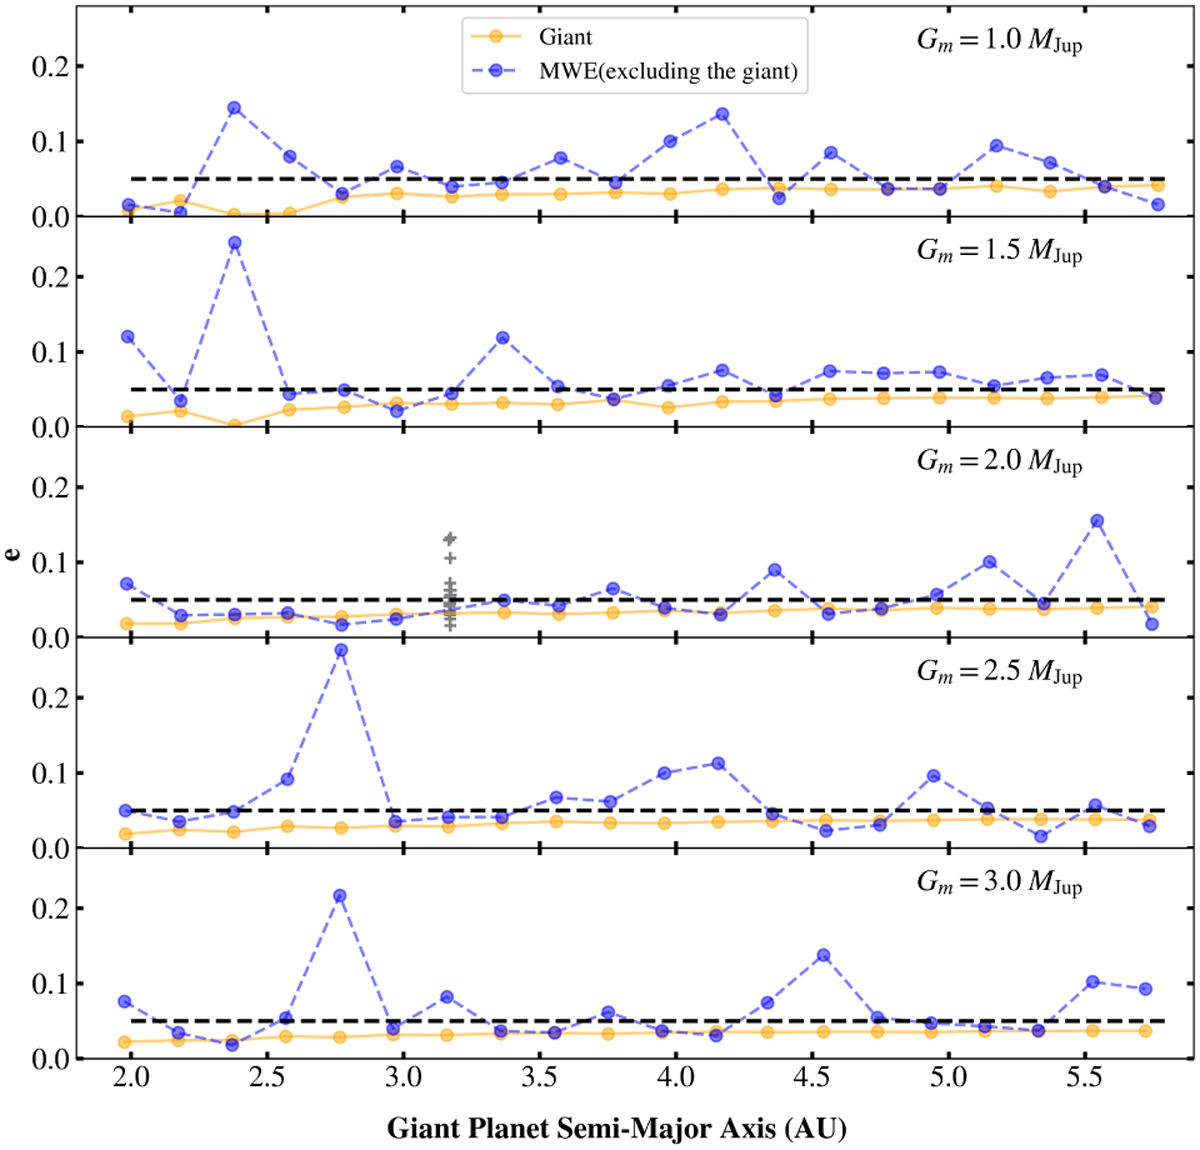
Eccentricity of the “with giant” group at 50 Myr. The black dashed line represents the initial eccentricity of the giant, set at 0.05, while the orange dots depict the final giant eccentricity. The blue dots represent the mass weighted eccentricity, excluding the giant. The gray crosses represent the mass weighted eccentricity, excluding the giant, for the clone_001-020.
Current usage metrics show cumulative count of Article Views (full-text article views including HTML views, PDF and ePub downloads, according to the available data) and Abstracts Views on Vision4Press platform.
Data correspond to usage on the plateform after 2015. The current usage metrics is available 48-96 hours after online publication and is updated daily on week days.
Initial download of the metrics may take a while.