Fig. 10
Download original image
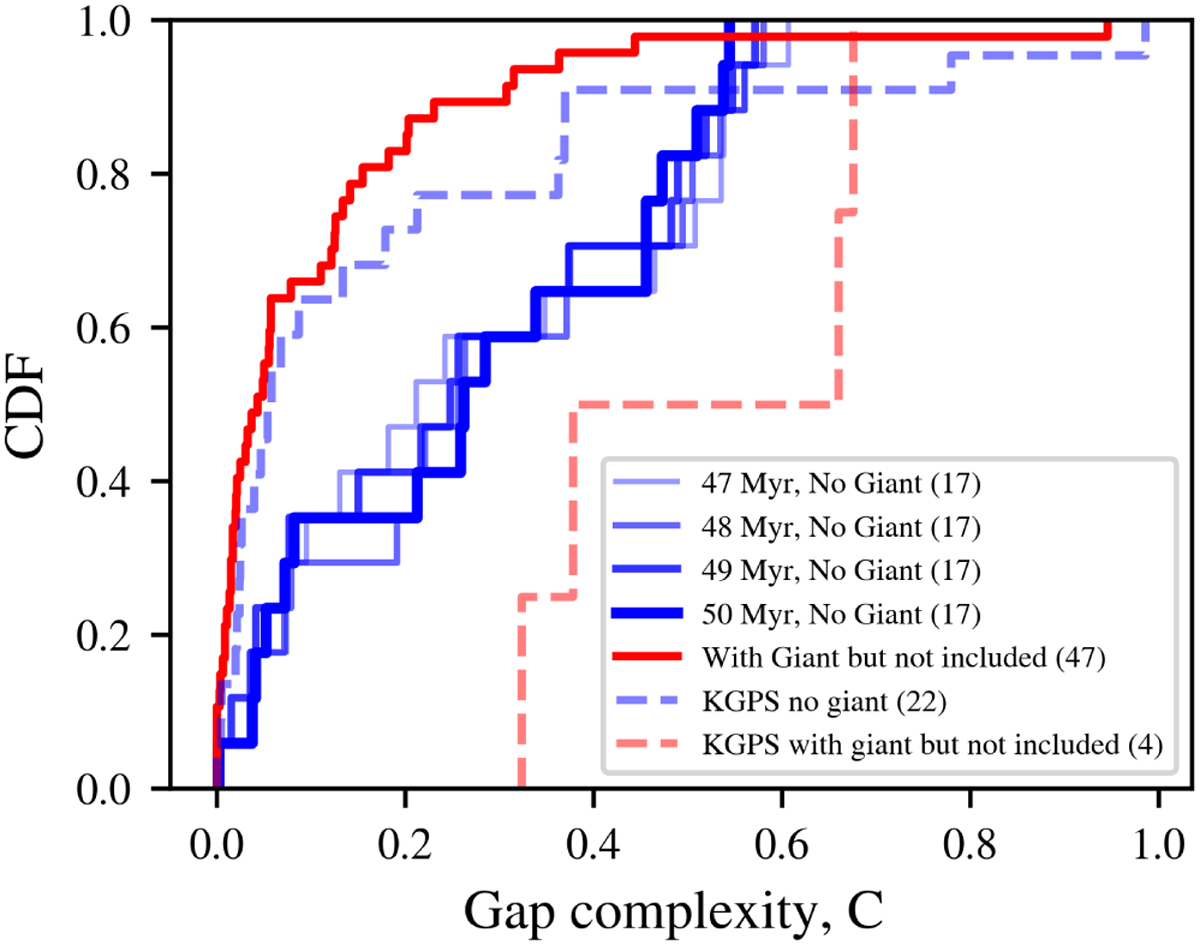
Cumulative distributions of gap complexity. The blue lines represent “no giant” group, while the gradient and thickness colors are used to represent time from 47 to 50 Myr. The red line represent the “with giant” group. The blue and red dashed lines indicate the results without and with giants in the observed sample KGPS, respectively. All samples exclude giant from gap complexity calculations. The legend indicates the number of available samples in each sample set.
Current usage metrics show cumulative count of Article Views (full-text article views including HTML views, PDF and ePub downloads, according to the available data) and Abstracts Views on Vision4Press platform.
Data correspond to usage on the plateform after 2015. The current usage metrics is available 48-96 hours after online publication and is updated daily on week days.
Initial download of the metrics may take a while.