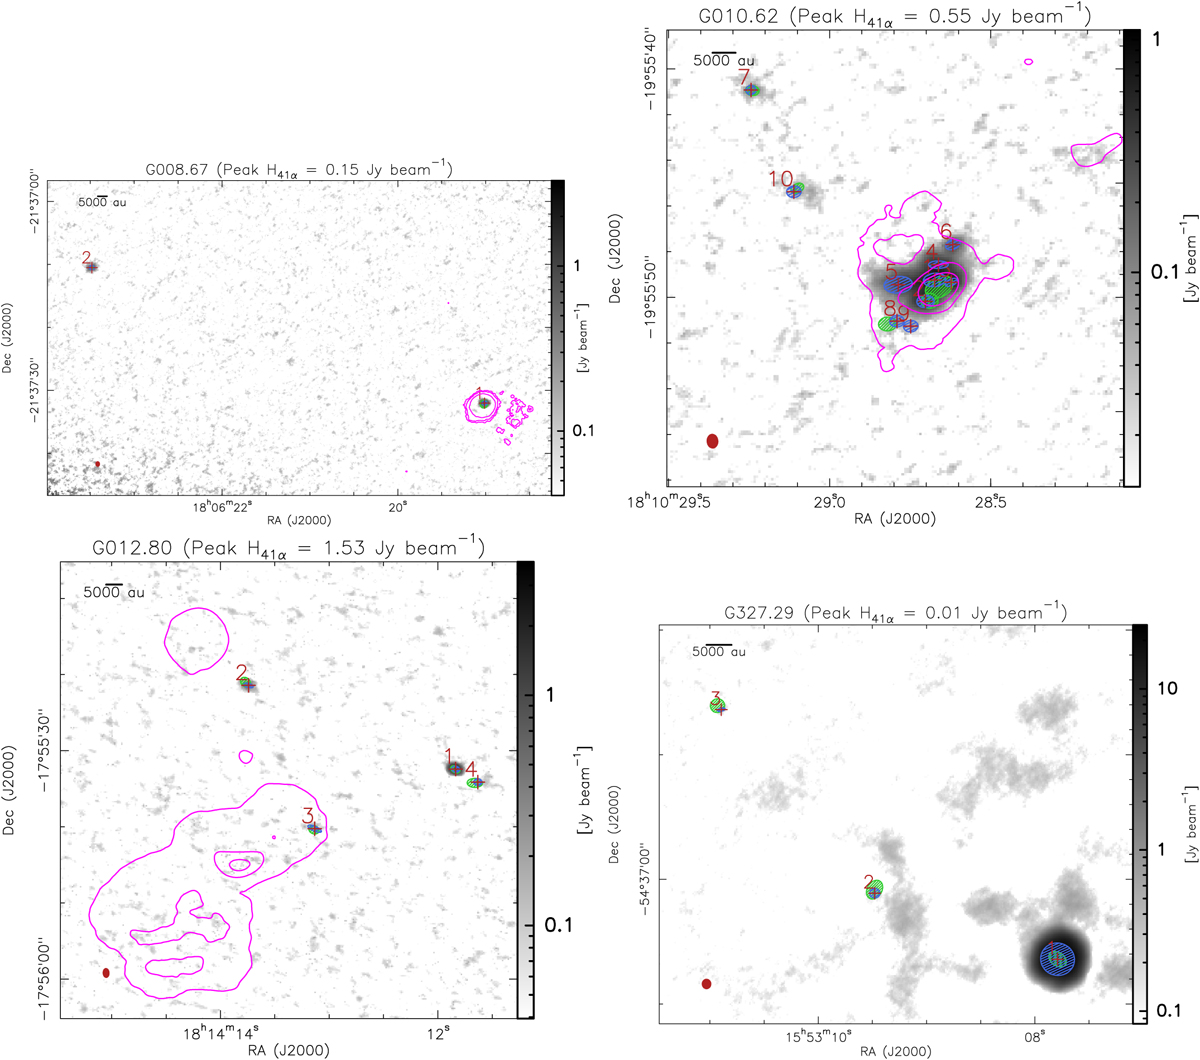
Fig. D.1
Download original image
Methyl formate moment 0 maps (background image) as shown in Fig. 3. The red crosses indicate the peak positions of the methyl formate sources, while the blue ellipses show the deconvolved emission sizes. The green ellipses show the deconvolved source sizes of the associated compact continuum cores. The synthesized beam size on the ALMA-IMF B6-SPW0 line cubes are shown with a red ellipse in the bottom left corner of each panel. Contours of the H41α emission are overlaid in magenta on top of the moment 0 maps of methyl formate, showing 2, 20, and 50% of the peak intensity, indicated on top of each panel. The figure continues on the next page.
Current usage metrics show cumulative count of Article Views (full-text article views including HTML views, PDF and ePub downloads, according to the available data) and Abstracts Views on Vision4Press platform.
Data correspond to usage on the plateform after 2015. The current usage metrics is available 48-96 hours after online publication and is updated daily on week days.
Initial download of the metrics may take a while.