Fig. 14
Download original image
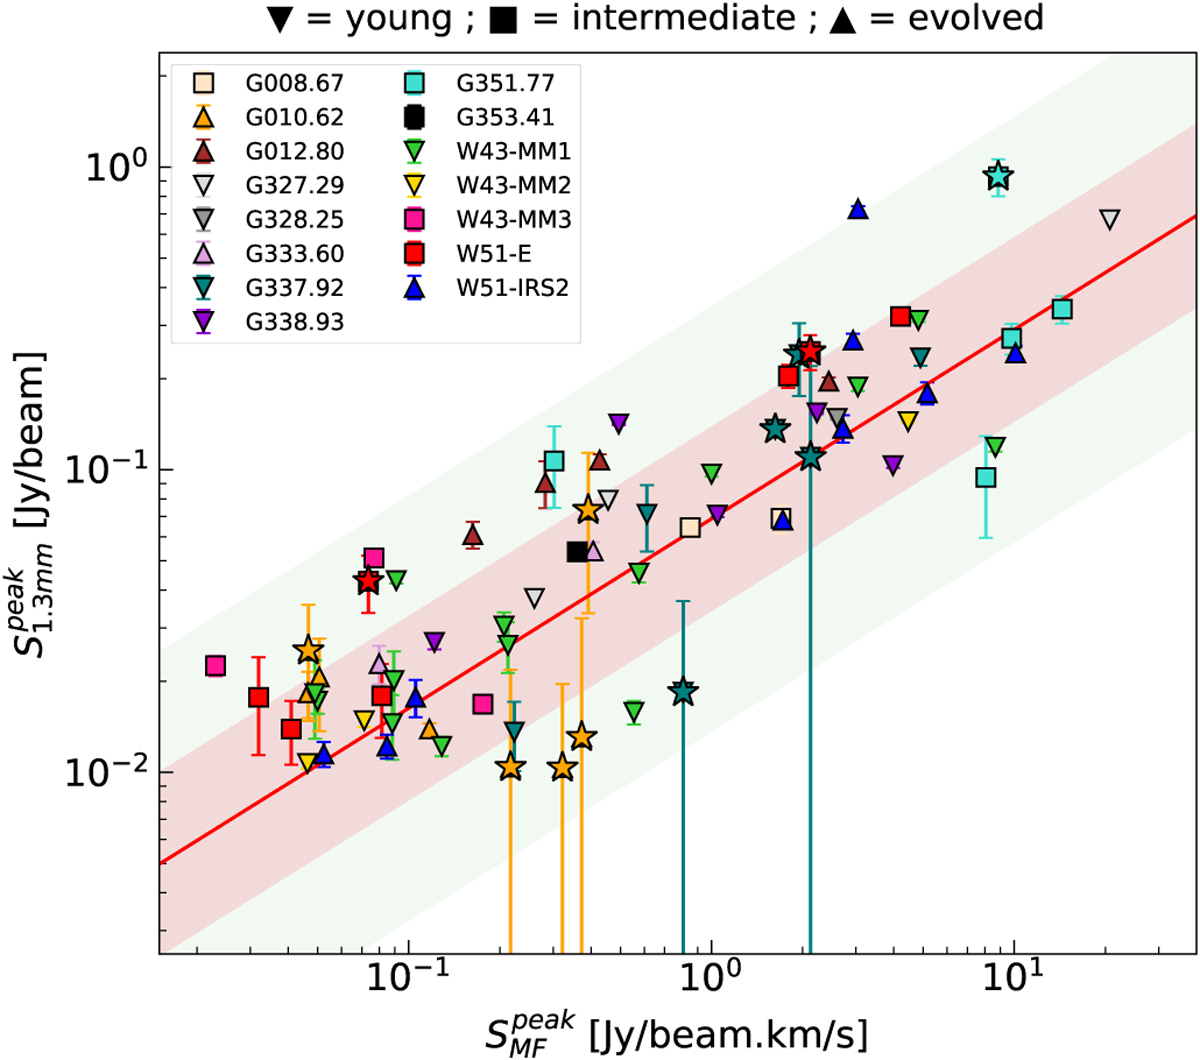
Peak continuum flux density at 1.3 mm vs. peak flux extracted in the moment 0 maps of CH3OCHO by GExt2D. The different symbols represent the different evolutionary stages of the protoclusters: young, intermediate and evolved, as indicated on top of the figure, while the stars shows the methyl formate sources that are not associated with any compact dust continuum core. The red line shows a weighted linear fit, while the red an green shaded regions show a factor of 2 and 5 deviation from this fit, respectively.
Current usage metrics show cumulative count of Article Views (full-text article views including HTML views, PDF and ePub downloads, according to the available data) and Abstracts Views on Vision4Press platform.
Data correspond to usage on the plateform after 2015. The current usage metrics is available 48-96 hours after online publication and is updated daily on week days.
Initial download of the metrics may take a while.