Fig. 12
Download original image
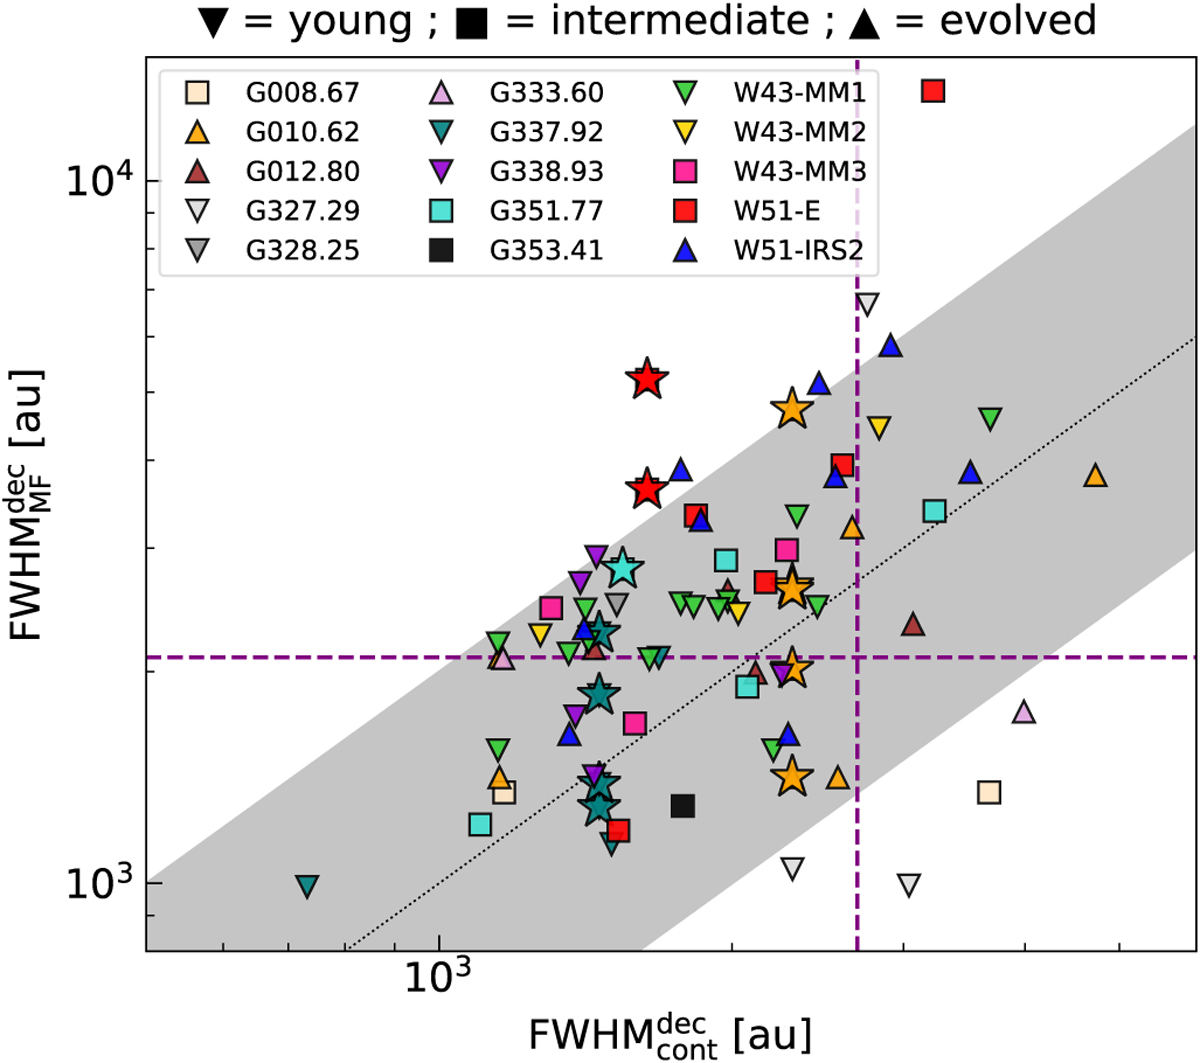
Methyl formate source sizes derived with GExt2D compared to the associated continuum core sizes taken from the unsmoothed core catalog from Paper XII. All sizes are deconvolved from the beam sizes. The black dotted line shows the one to one ratio, while the gray shaded area shows where the ![]() sizes are within a factor of 2 of their associated
sizes are within a factor of 2 of their associated ![]() sizes. The different symbols represent the different evolutionary stages of the protoclusters: young, intermediate, or evolved, as shown on top of the figure. The methyl formate sources that are not associated with compact continuum cores are shown with stars. For these sources we assumed
sizes. The different symbols represent the different evolutionary stages of the protoclusters: young, intermediate, or evolved, as shown on top of the figure. The methyl formate sources that are not associated with compact continuum cores are shown with stars. For these sources we assumed ![]() . The vertical and horizontal dashed lines show the median beam sizes of the line cubes and the continuum maps, respectively.
. The vertical and horizontal dashed lines show the median beam sizes of the line cubes and the continuum maps, respectively.
Current usage metrics show cumulative count of Article Views (full-text article views including HTML views, PDF and ePub downloads, according to the available data) and Abstracts Views on Vision4Press platform.
Data correspond to usage on the plateform after 2015. The current usage metrics is available 48-96 hours after online publication and is updated daily on week days.
Initial download of the metrics may take a while.