Fig. 10
Download original image
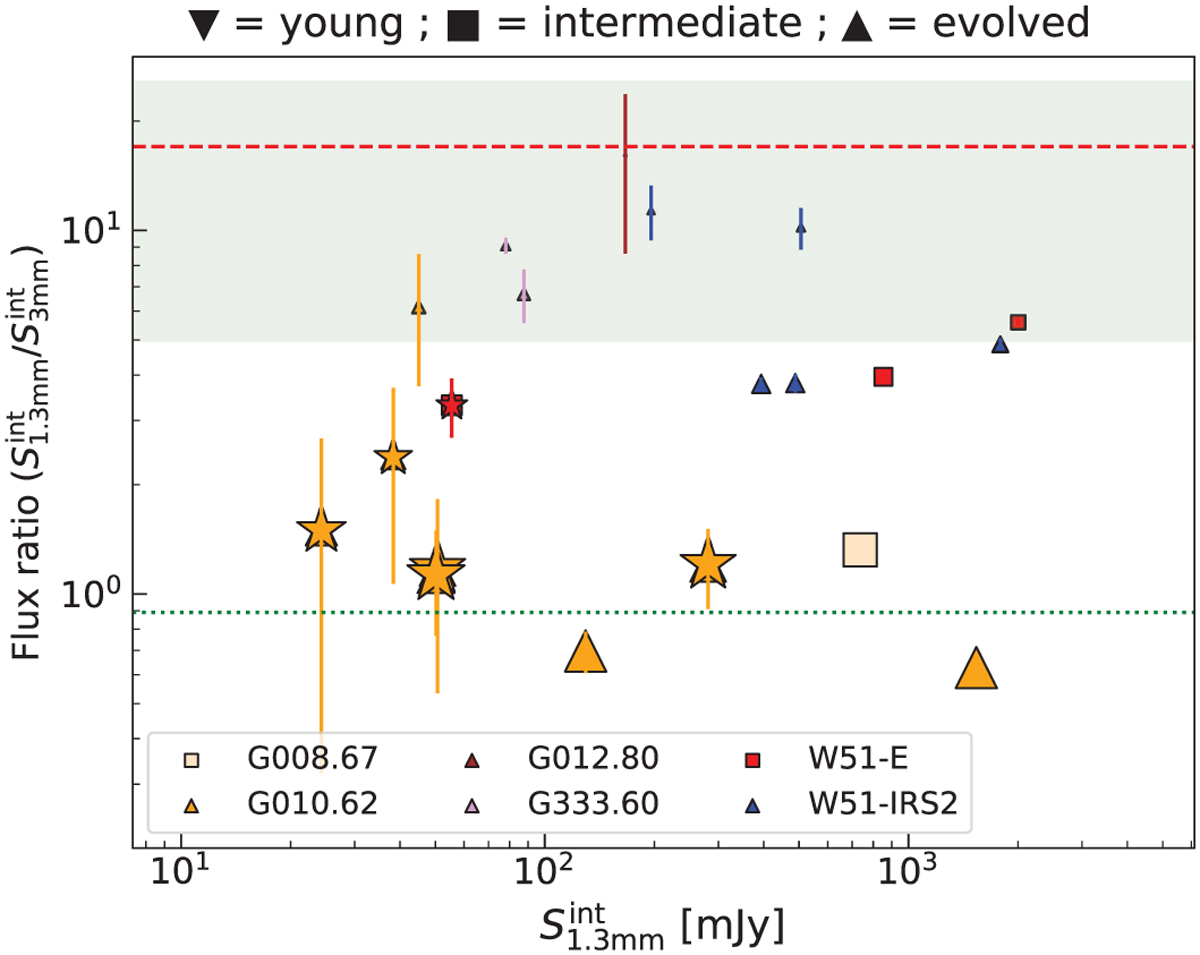
Flux ratio ![]() measured toward the methyl formate sources whose positions coincide with the H41α emission in six ALMA-IMF protoclusters (see Figs. D.1–D.4). The different symbols represent the different evolutionary stages of the protoclusters: young, intermediate, or evolved, as shown on top of the figure. The methyl formate sources that are not associated with compact continuum cores are shown with stars. The size of each marker is proportional to the level of free-free contamination (e.g., the biggest markers correspond to G010.62–MF1 and G010.62–MF2 for which 100% of the flux measured at 1.3 mm is expected to be due to free-free emission). The green shaded area shows the theoretical ratio expected for dust cores, computed for a dust emissivity exponent α ranging from 2 to 4, for optically thin and thick dust emission, respectively. The dashed red line shows the theoretical ratio obtained using α = 3.5 (as in Paper III), while the green dotted line shows the theoretical ratio expected for optically thin HII regions, corresponding to α = −0.1.
measured toward the methyl formate sources whose positions coincide with the H41α emission in six ALMA-IMF protoclusters (see Figs. D.1–D.4). The different symbols represent the different evolutionary stages of the protoclusters: young, intermediate, or evolved, as shown on top of the figure. The methyl formate sources that are not associated with compact continuum cores are shown with stars. The size of each marker is proportional to the level of free-free contamination (e.g., the biggest markers correspond to G010.62–MF1 and G010.62–MF2 for which 100% of the flux measured at 1.3 mm is expected to be due to free-free emission). The green shaded area shows the theoretical ratio expected for dust cores, computed for a dust emissivity exponent α ranging from 2 to 4, for optically thin and thick dust emission, respectively. The dashed red line shows the theoretical ratio obtained using α = 3.5 (as in Paper III), while the green dotted line shows the theoretical ratio expected for optically thin HII regions, corresponding to α = −0.1.
Current usage metrics show cumulative count of Article Views (full-text article views including HTML views, PDF and ePub downloads, according to the available data) and Abstracts Views on Vision4Press platform.
Data correspond to usage on the plateform after 2015. The current usage metrics is available 48-96 hours after online publication and is updated daily on week days.
Initial download of the metrics may take a while.