Fig. 1.
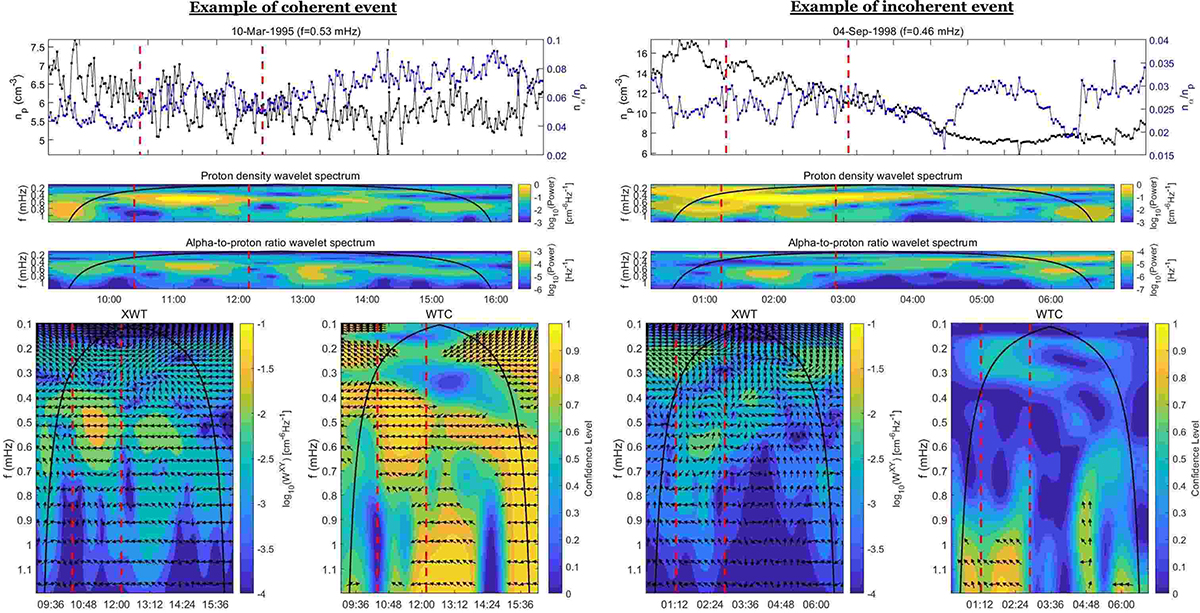
Download original image
Example of a coherent (left panels) and incoherent (right panels) event. From top to bottom: time series of np and nα/np (black and blue lines, respectively), wavelet spectrum for np, wavelet power spectrum for nα/np, cross-wavelet spectrum, and wavelet coherence. The vertical dashed red lines correspond to the times at whic the wavelet power, at the corresponding PDS frequency exceeds the 75th quantile of the power of the entire six-hour interval. The solid black lines in all spectra depict the cone of influence, where edge effects in the processing become important. The arrows in XWT and WTC point to the phase relation of the two data series in time-frequency space: (1) Arrows pointing to the right indicate in-phase behavior, and (2) arrows pointing to the left indicate antiphase behavior.
Current usage metrics show cumulative count of Article Views (full-text article views including HTML views, PDF and ePub downloads, according to the available data) and Abstracts Views on Vision4Press platform.
Data correspond to usage on the plateform after 2015. The current usage metrics is available 48-96 hours after online publication and is updated daily on week days.
Initial download of the metrics may take a while.