Fig. 7
Download original image
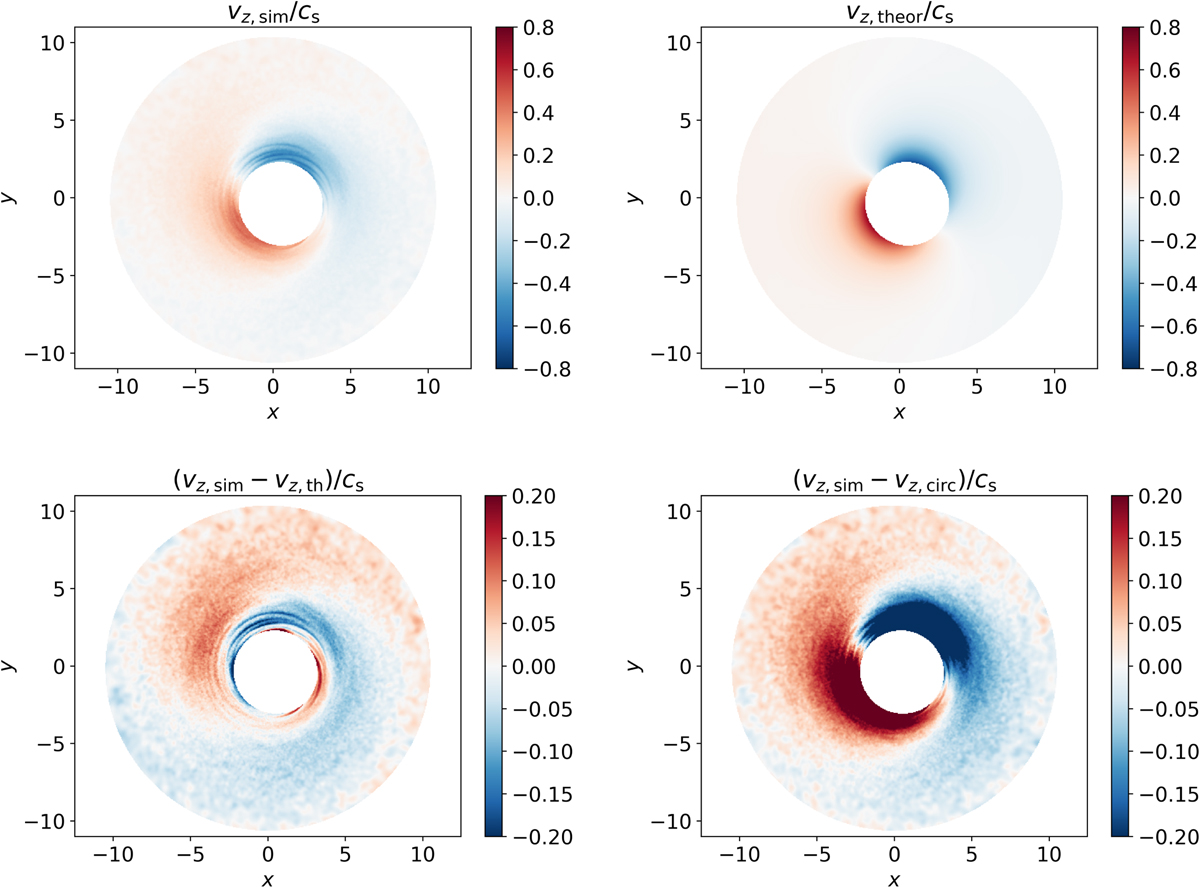
Maps of disc vertical velocity υz. Top panels: υz,sim/cs velocity field from the simulation (top left panel) compared to the theoretical model υz,th/cs obtained solving Eq. (29) (top right panel). Bottom panels: residuals of the simulation against the theoretical model (υz,sim − υz,th)/cs (bottom left panel), i.e. the top left panel minus the top right panel of this figure, and with respect to a circular disc (υz,sim − υz,circ)/cs (bottom right panel), i.e. υz,circ = 0; this last plot is in fact the same as top left panel but with rescaled colourbar for a direct comparison with the other residuals plot in the bottom left panel. We note that in the simulation the m = 1 spiral shaped vertical velocity feature standing out even after the subtraction of the eccentric theoretical model suggests that some additional physical processes are affecting the disc dynamics.
Current usage metrics show cumulative count of Article Views (full-text article views including HTML views, PDF and ePub downloads, according to the available data) and Abstracts Views on Vision4Press platform.
Data correspond to usage on the plateform after 2015. The current usage metrics is available 48-96 hours after online publication and is updated daily on week days.
Initial download of the metrics may take a while.