Fig. 4
Download original image
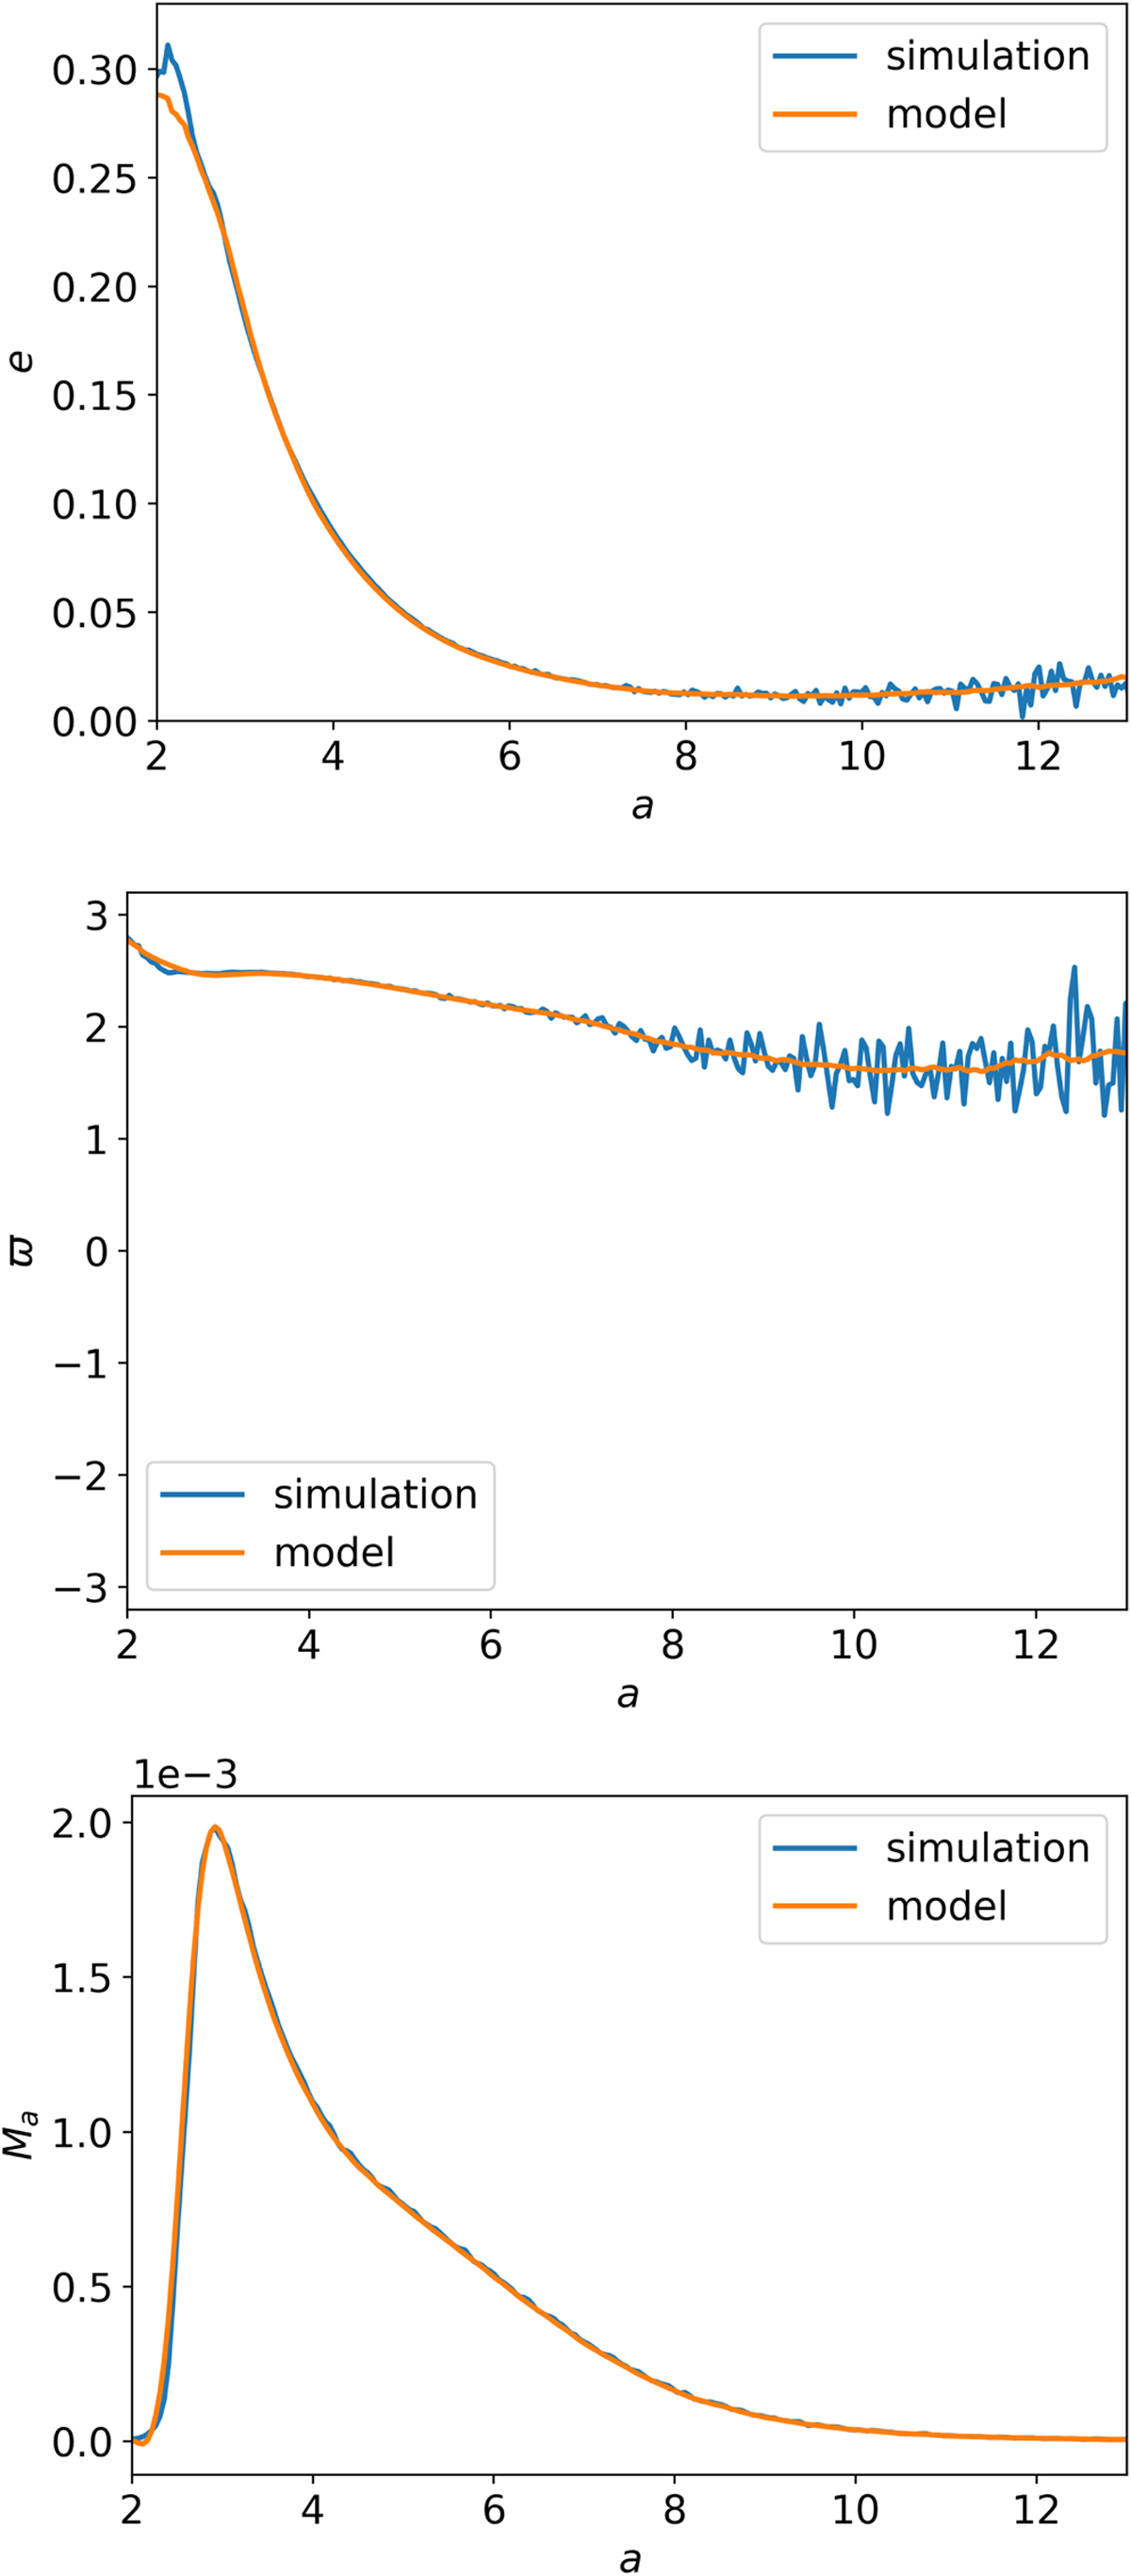
Profiles of e(a) (top panel), ϖ(a) (middle panel), and Ma (bottom panel) from our reference simulation (blue curves) and corresponding filtered-interpolated profiles (orange curves). For clarity, we remark that the orange curves are obtained by filtering and interpolating with cubic splines the blue curve. The orange curve is used as an input to generate the theoretical model based on the numerical simulation.
Current usage metrics show cumulative count of Article Views (full-text article views including HTML views, PDF and ePub downloads, according to the available data) and Abstracts Views on Vision4Press platform.
Data correspond to usage on the plateform after 2015. The current usage metrics is available 48-96 hours after online publication and is updated daily on week days.
Initial download of the metrics may take a while.