Fig. D.1
Download original image
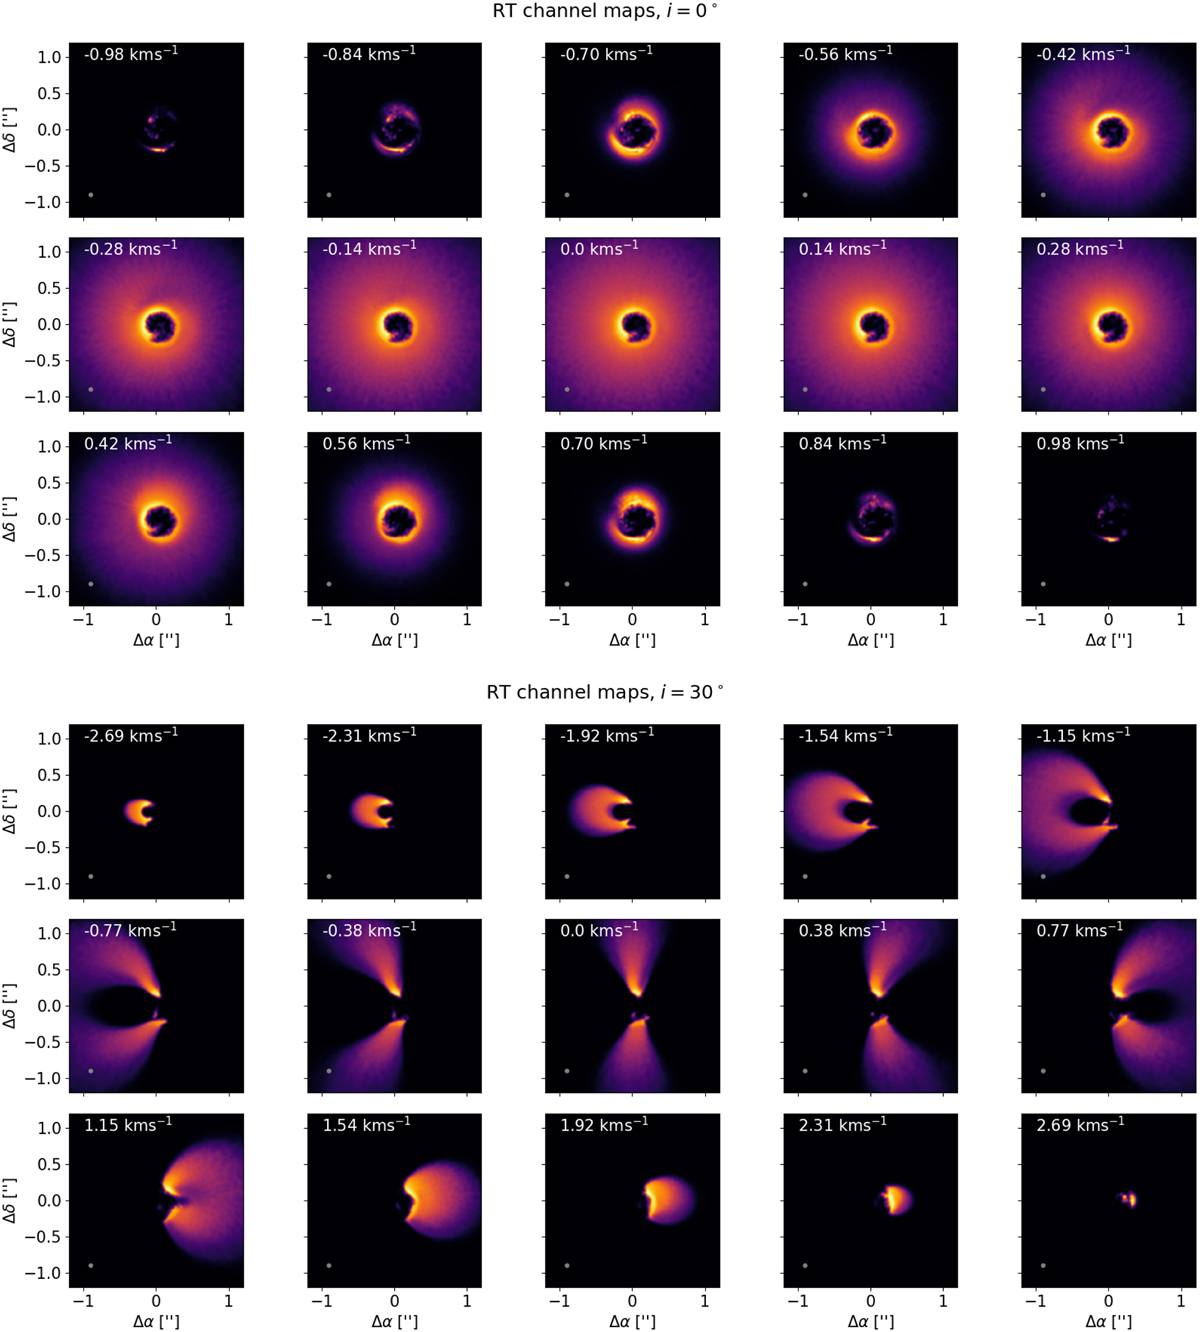
Selection of channel maps from the RT model for the inclination i = 0° (top panels) and i = 30° (bottom panels), after smoothing the synthetic image from MCFOST using a circular Gaussian beam with Δx = 0.05″ and Δv = 0.05 kms−1. The velocity of each channel is marked in the top left corner of each panel. The grey circle in the bottom left corner represents the corresponding beam size.
Current usage metrics show cumulative count of Article Views (full-text article views including HTML views, PDF and ePub downloads, according to the available data) and Abstracts Views on Vision4Press platform.
Data correspond to usage on the plateform after 2015. The current usage metrics is available 48-96 hours after online publication and is updated daily on week days.
Initial download of the metrics may take a while.