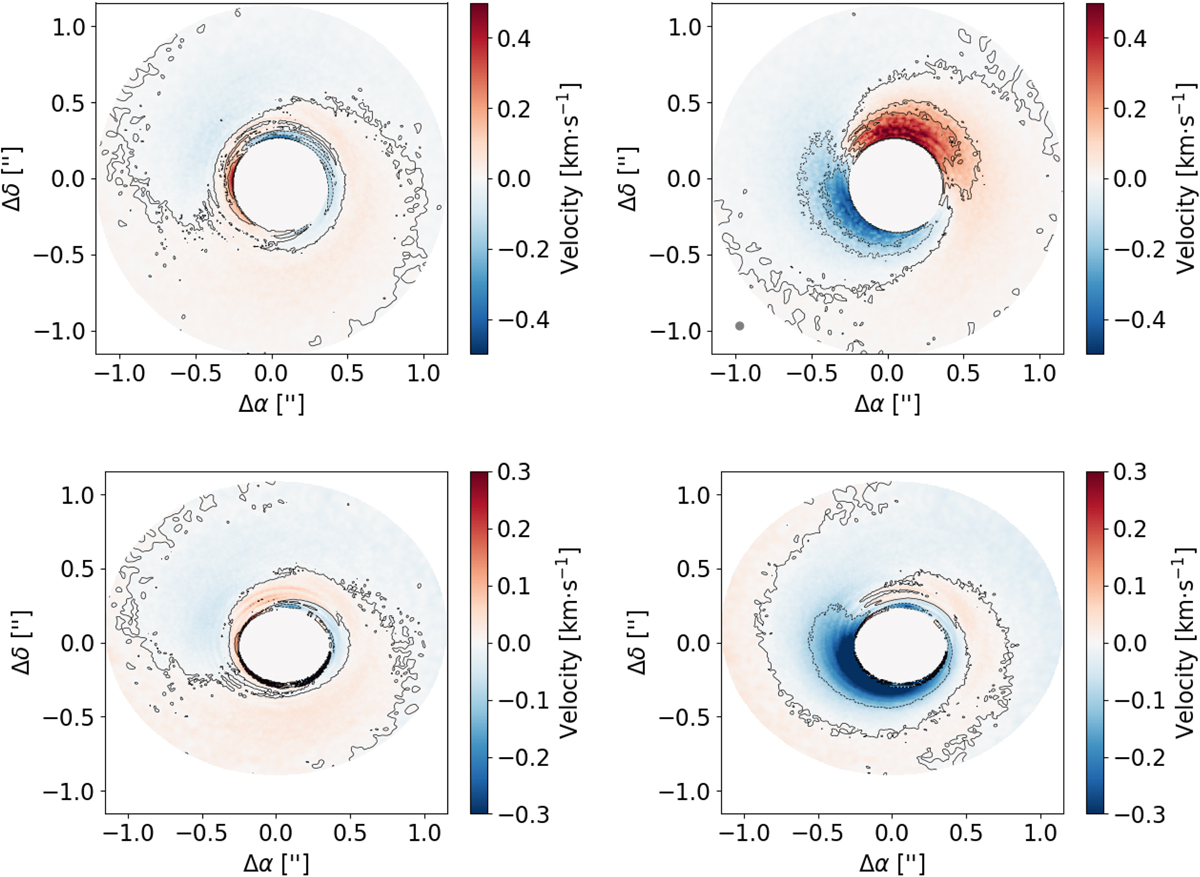
Fig. 12
Download original image
Residuals of the subtraction of the eccentric theoretical model (left panels) and circular model (right panels) from the projected velocity in the simulation for i = 0° (top panels) and i = 30° (bottom panels). These maps were obtained assuming the upper emission surface to be Hτ=1 = 2.5H (as discussed in Sect. 5.3), and rescaling the simulations to have a binary with abin = 15 au, Mbin = 1 M⊙, placed at a distance of d = 130 pc. Similarly to Fig. 9, we note that the convention about velocities in observations is that blue-shift of lines is associated with negative velocities, while red-shift is associated with positive velocities – for example, this implies that υz in this plot is opposite in sign with respect to that in Fig. 7. We note that the top right panel residual is obtained by subtracting υz,circ = 0 (as the circular case does not have vertical motion) from υz, thus this residuals map portrays the vertical velocity map on the τ = 1 surface for the case i = 0°. This highlights that the amplitude of the vertical oscillations reaches υz ~ 0.4 km s−1 in the upper emission layer.
Current usage metrics show cumulative count of Article Views (full-text article views including HTML views, PDF and ePub downloads, according to the available data) and Abstracts Views on Vision4Press platform.
Data correspond to usage on the plateform after 2015. The current usage metrics is available 48-96 hours after online publication and is updated daily on week days.
Initial download of the metrics may take a while.