Fig. 10
Download original image
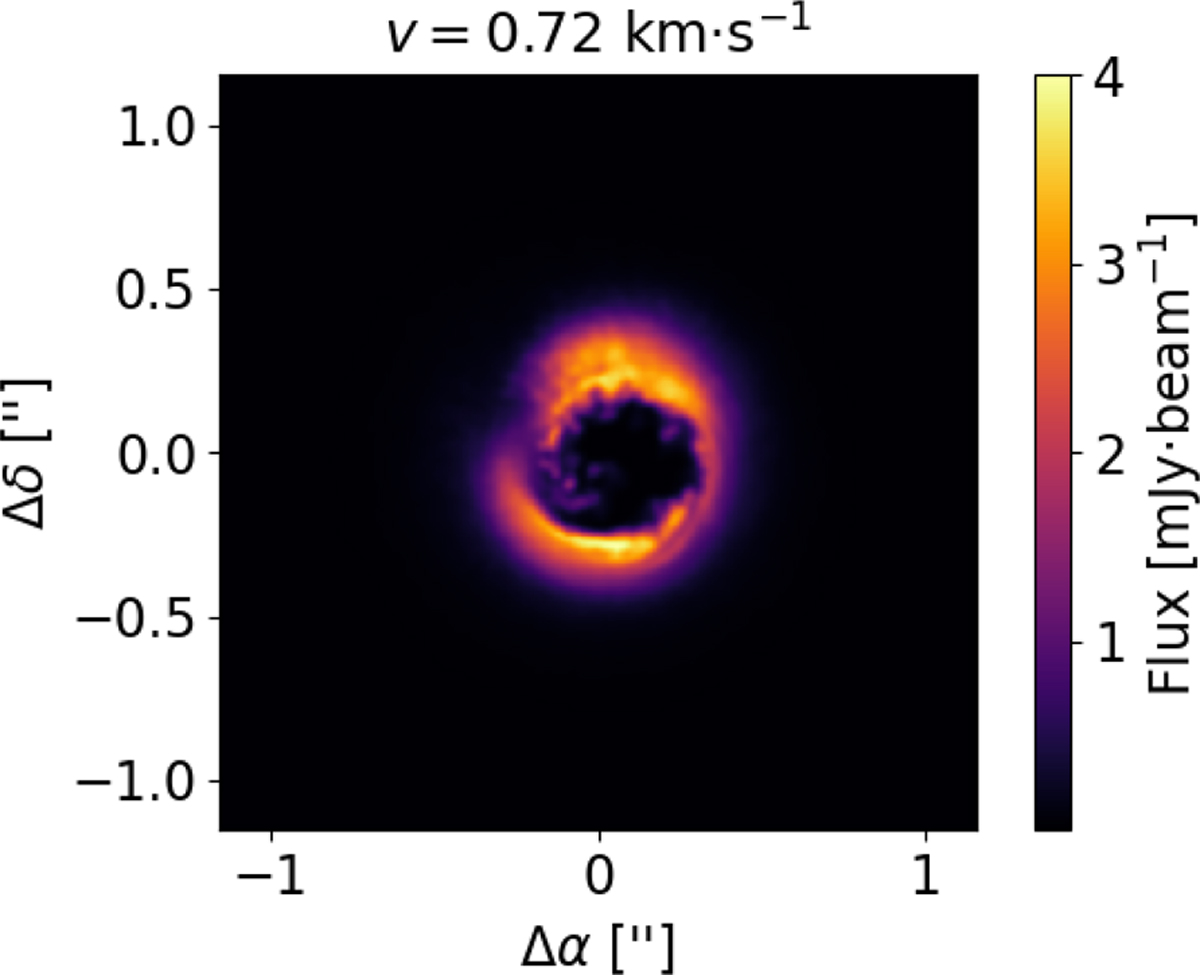
Brightness map of the 0.72 km s−1 channel from the data cube of the Monte Carlo radiative transfer, face-one i = 0° inclination, performed on the simulation dump. The image clearly shows that, even though the M9 map in Fig. 9 shows maximum velocity of ~ 0.25 km s−1 for vertical velocities, a bright contribution in higher velocities channels is also expected to be observable.
Current usage metrics show cumulative count of Article Views (full-text article views including HTML views, PDF and ePub downloads, according to the available data) and Abstracts Views on Vision4Press platform.
Data correspond to usage on the plateform after 2015. The current usage metrics is available 48-96 hours after online publication and is updated daily on week days.
Initial download of the metrics may take a while.