Fig. 9.
Download original image
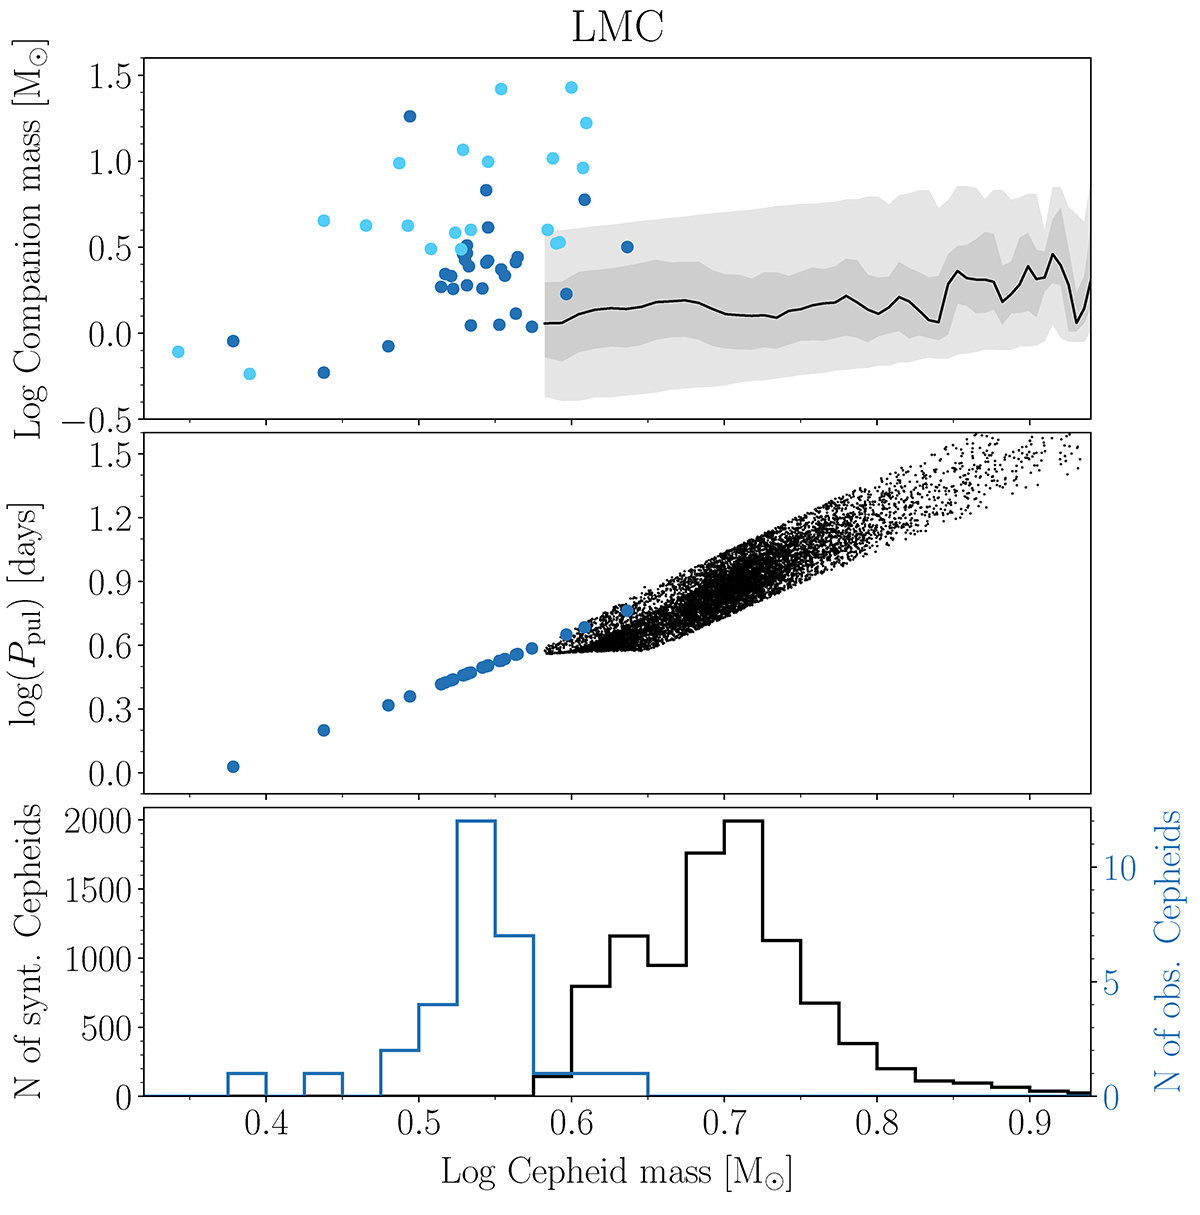
Distribution of estimated minimum companion masses as a function of derived Cepheid masses in the LMC (top), represented by dark blue circles (fundamental-mode Cepheids) and light blue circles (first-overtone Cepheids). Black line indicates the median companion mass from the binary synthetic population (Karczmarek et al. 2022), with half of the companions (1st to 3rd quartile) lying inside the dark-shaded area, and the entire sample enclosed by the light-shaded area. Relation between the Cepheid mass and pulsation period (middle) for observed fundamental-mode Cepheids (dark blue circles, derived from the inverse of Eq. (8)) and for synthetic ones (black dots). Mass distribution of synthetic LMC Cepheids (bottom), shown as a black histogram, which offers additional information about the number of systems that were used to calculate the median companion mass (in the top panel). For comparison the mass distribution of observed LMC fundamental-mode Cepheids is given in dark blue.
Current usage metrics show cumulative count of Article Views (full-text article views including HTML views, PDF and ePub downloads, according to the available data) and Abstracts Views on Vision4Press platform.
Data correspond to usage on the plateform after 2015. The current usage metrics is available 48-96 hours after online publication and is updated daily on week days.
Initial download of the metrics may take a while.