Fig. 6.
Download original image
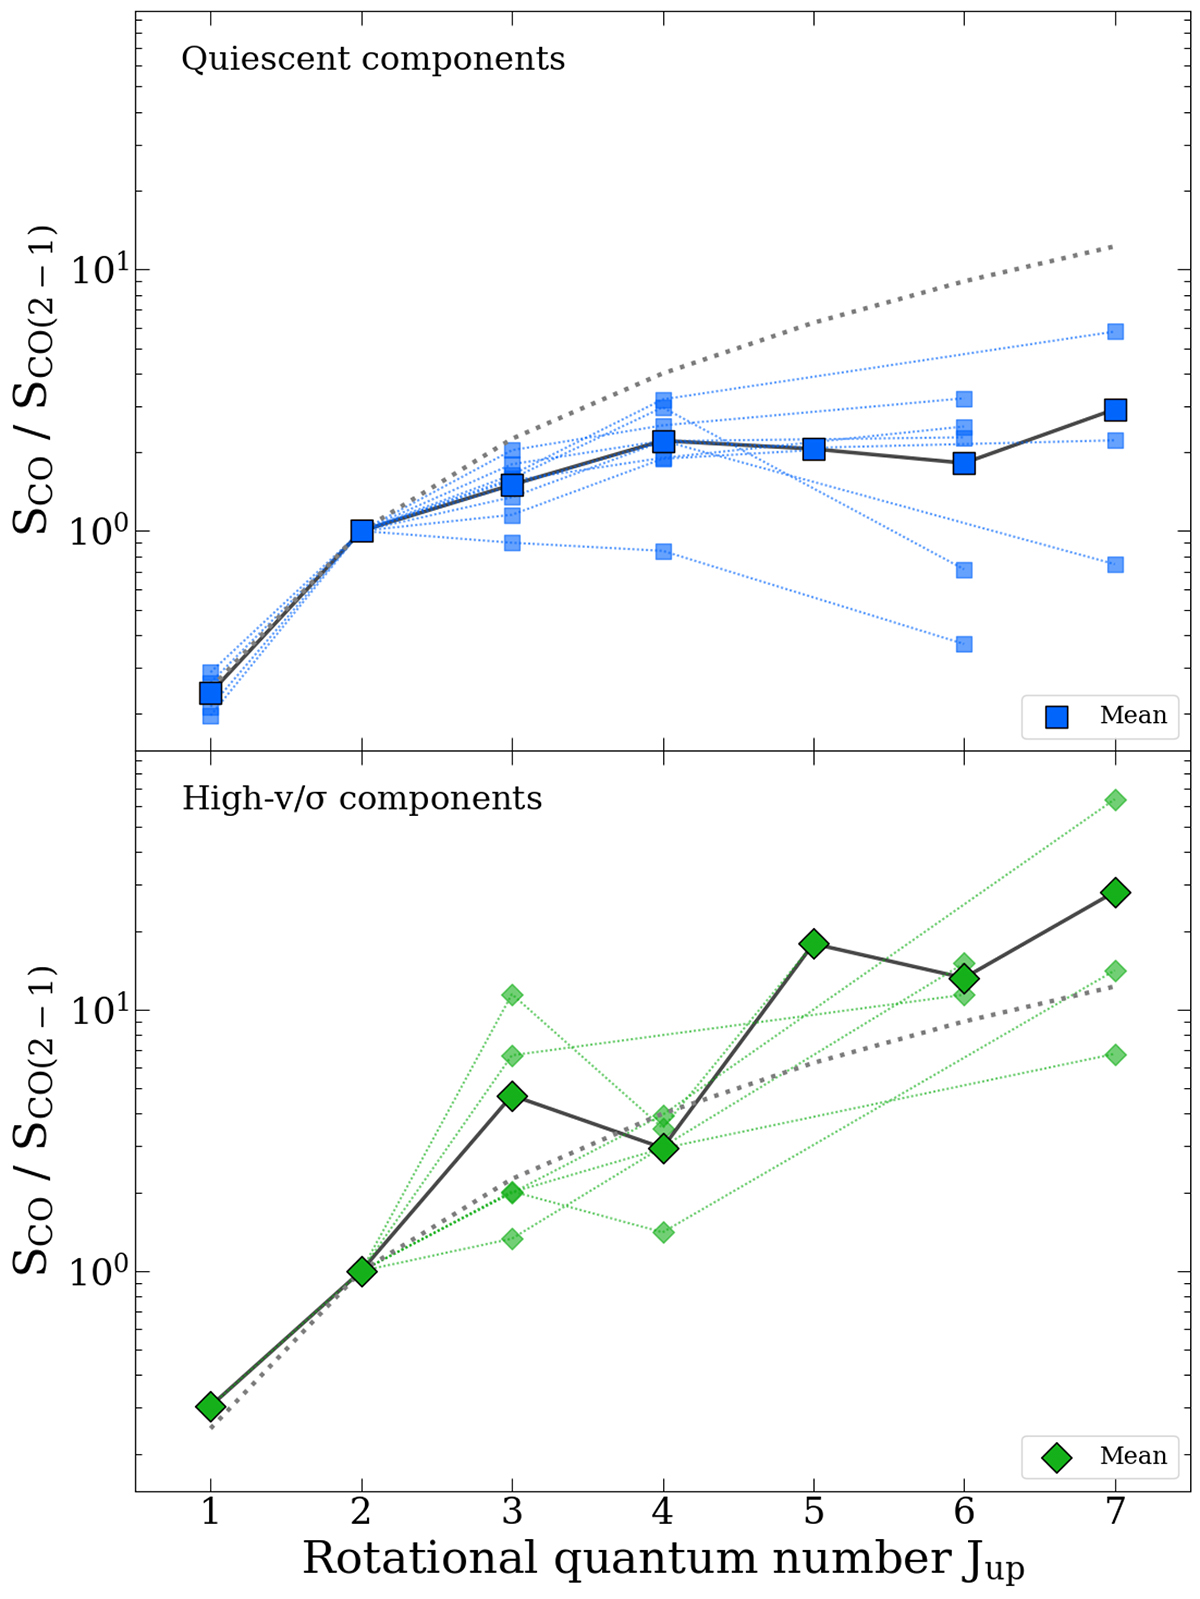
Top panel: CO SLEDs for the spectral components that lie within the blue rectangle in Fig. 6 probing dynamically quiescent gas. Bottom panel: CO SLEDs for the spectral components that lie outside the blue rectangle in Fig. 6, likely containing molecular outflows in these sources. Only higher-excitation ULIRGs are included in this analysis (see Sect. 3.2). Quiescent components show significantly less excited CO SLEDs compared to the high-v/high-σ spectral components. The dotted gray lines show the thermalized optically thick limit (in all lines) SLED profiles, normalized to the CO(2−1) transition.
Current usage metrics show cumulative count of Article Views (full-text article views including HTML views, PDF and ePub downloads, according to the available data) and Abstracts Views on Vision4Press platform.
Data correspond to usage on the plateform after 2015. The current usage metrics is available 48-96 hours after online publication and is updated daily on week days.
Initial download of the metrics may take a while.