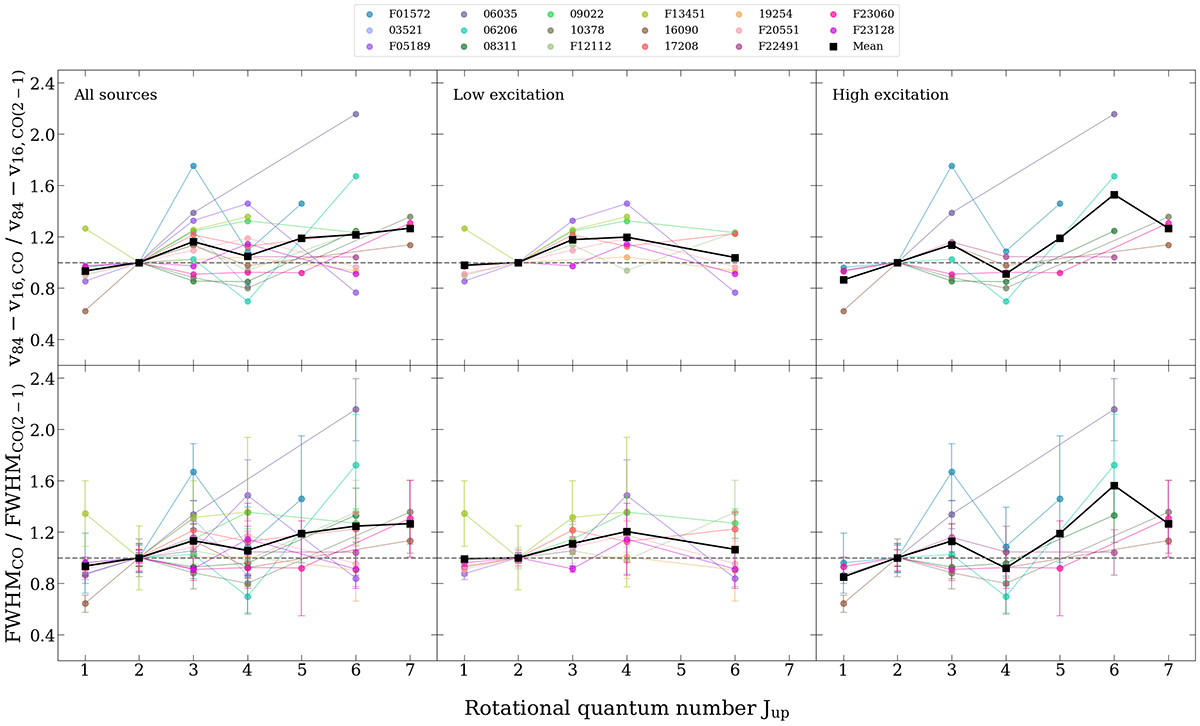
Fig. 4.
Download original image
Observed CO line widths (normalized by the CO(2−1) line width) as a function of the upper rotational quantum number Jup. Top row: CO line widths computed using the velocity percentile v84 − v16 interval, derived from the analytical expression of the best-fit line profile obtained with the multi-Gaussian fit. Bottom row: line widths obtained via a single Gaussian spectral fit to each CO emission line. Left column: all the sources in our sample; middle and right columns show the ULIRGs with low and high excitation CO SLEDs, respectively (see explanation in Sect. 3.1). The sources are color coded as presented in the upper legend, the mean trend is computed for each plot and shown with black square markers.
Current usage metrics show cumulative count of Article Views (full-text article views including HTML views, PDF and ePub downloads, according to the available data) and Abstracts Views on Vision4Press platform.
Data correspond to usage on the plateform after 2015. The current usage metrics is available 48-96 hours after online publication and is updated daily on week days.
Initial download of the metrics may take a while.