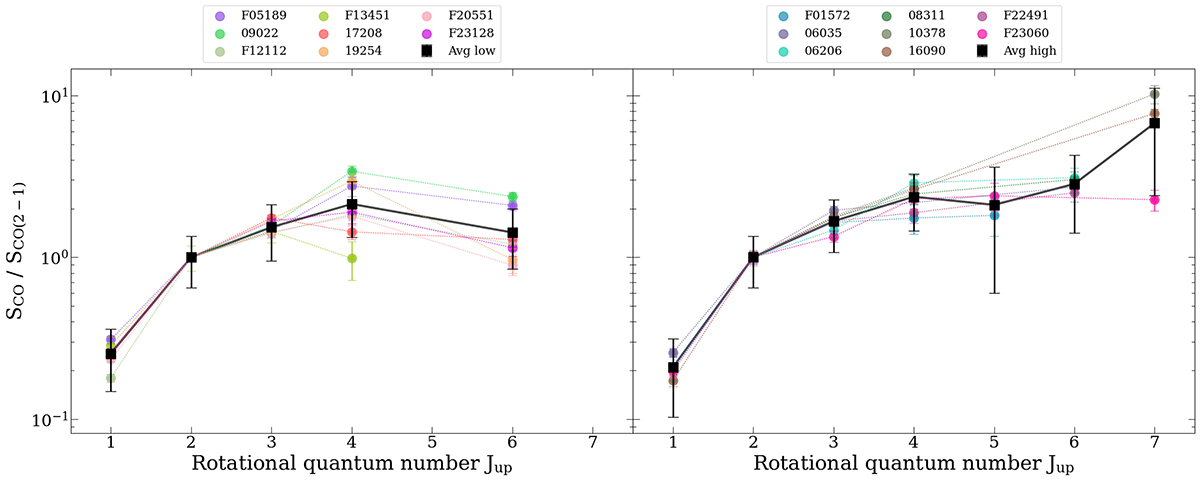
Fig. 3.
Download original image
CO SLEDs of the ULIRGs classified as having lower excitation (left panel) and higher excitation (right panel) gas, following the classification criteria described in Sect. 3.2. Each source is shown in a different color, according to the legend reported on the top of each panel. The average CO SLED of each group of galaxies is also computed and plotted using black square symbols connected by a black solid line.
Current usage metrics show cumulative count of Article Views (full-text article views including HTML views, PDF and ePub downloads, according to the available data) and Abstracts Views on Vision4Press platform.
Data correspond to usage on the plateform after 2015. The current usage metrics is available 48-96 hours after online publication and is updated daily on week days.
Initial download of the metrics may take a while.