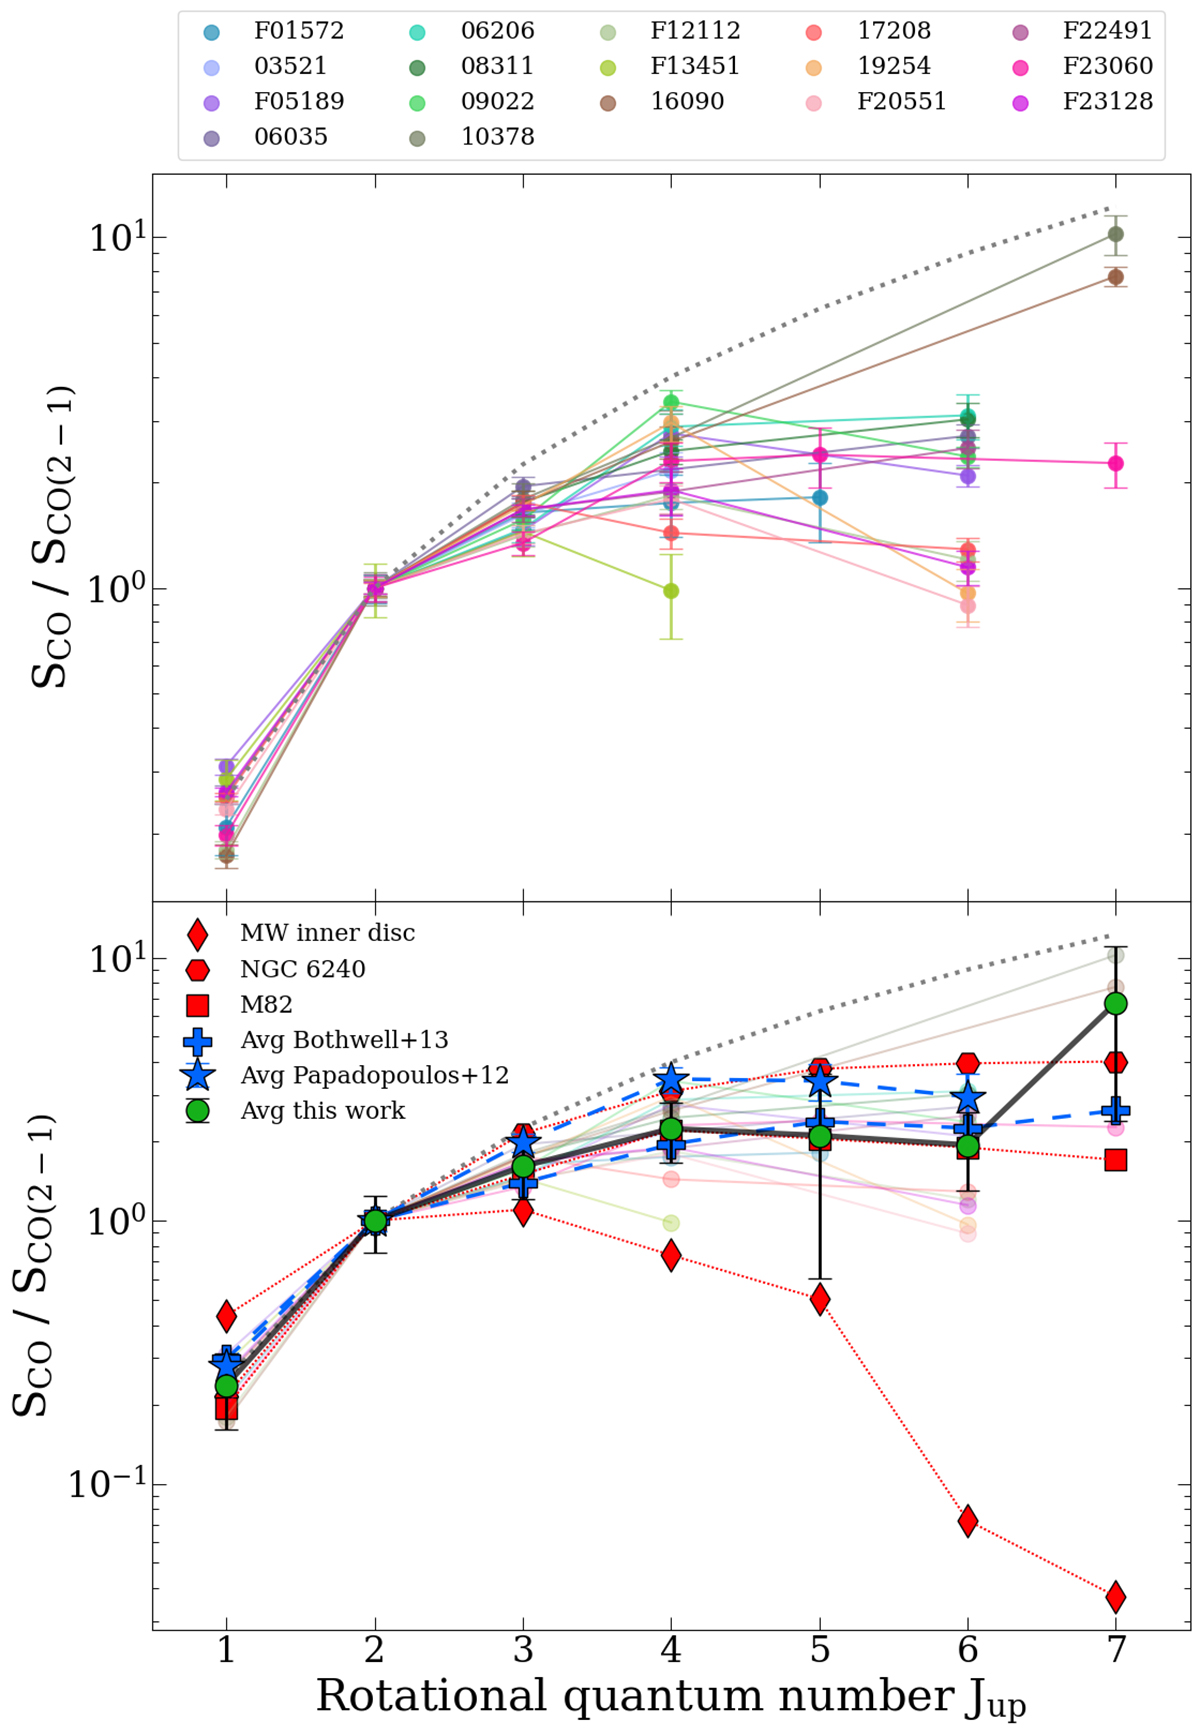
Fig. 2.
Download original image
Top panel: observed CO SLEDs for the ULIRGs in our sample. The color coding is shown in the legend on top of the figure. Bottom panel: we compute the average CO SLED of our sample, and compare it to other well-studied galaxies, the starburst galaxy M 82 (Mashian et al. 2015), the nearby ULIRG NGC 6240 (hosting a dual AGN and a SB; Papadopoulos et al. 2014), and the Milky Way inner disk (Fixsen et al. 1999). We also show the average CO SLEDs for a sample of local (U)LIRGs studied by Papadopoulos et al. (2012), and a sample of high-z SMGs (Bothwell et al. 2013). In both panels, the dotted gray line corresponds to a constant brightness temperature in the Rayleigh-Jeans regime (i.e., Sν ∼ ν2), which is the trend expected for thermally excited CO emission, in the optically thick limit for all lines. All line fluxes are in units of Jy km s−1, normalized by the CO(2−1) flux measured by APEX.
Current usage metrics show cumulative count of Article Views (full-text article views including HTML views, PDF and ePub downloads, according to the available data) and Abstracts Views on Vision4Press platform.
Data correspond to usage on the plateform after 2015. The current usage metrics is available 48-96 hours after online publication and is updated daily on week days.
Initial download of the metrics may take a while.