Fig. B.8.
Download original image
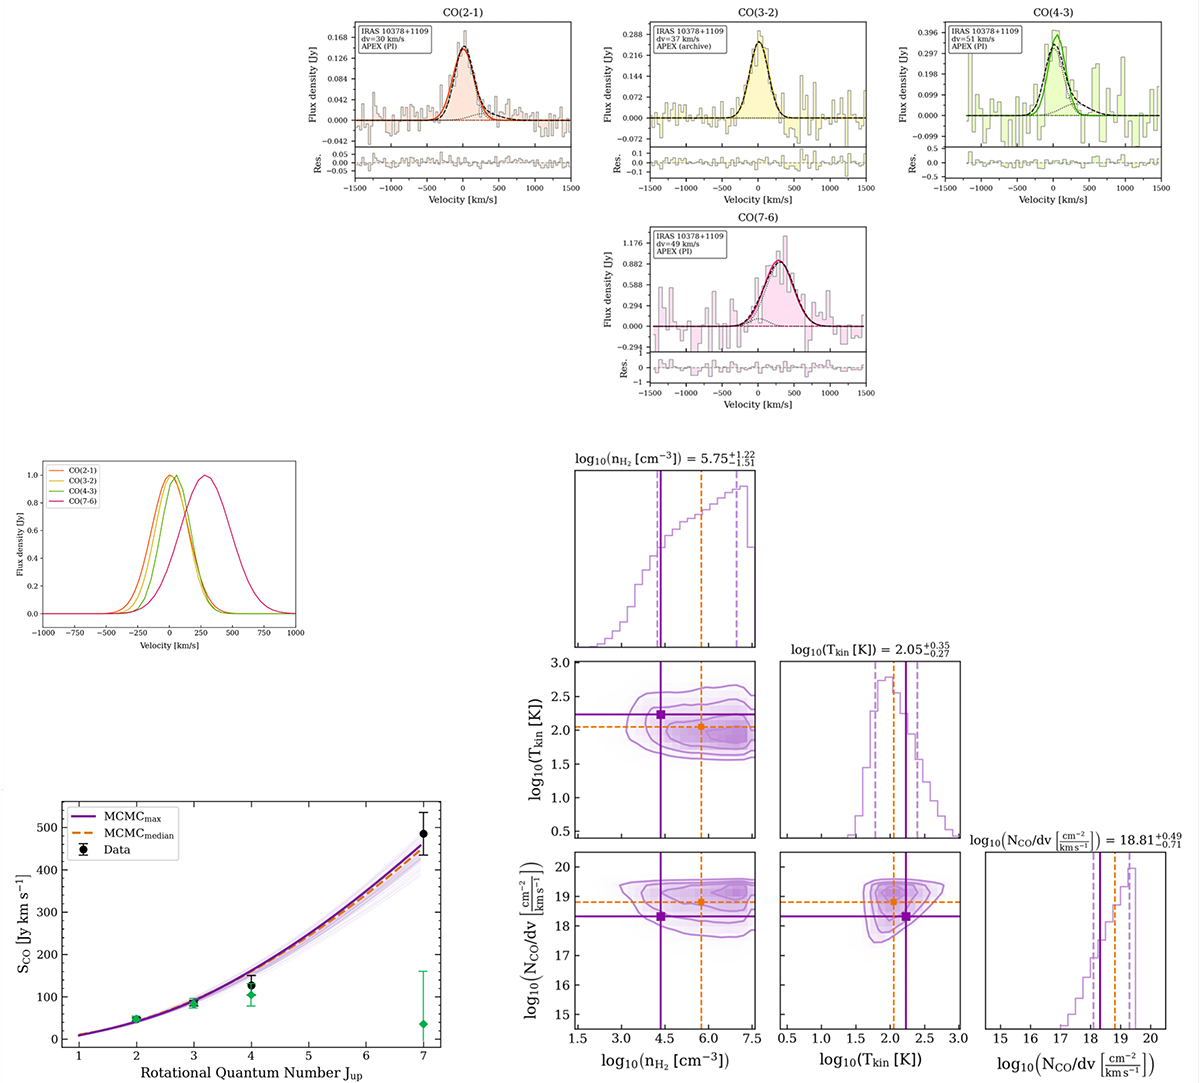
Continued from Fig. B.1 but for source IRAS 10378+1109. The green data points in the bottom-left panel showing the CO SLED correspond to the fluxes of the systemic velocity components (with central velocity vcen ≈ 12 km s−1), resulting from the simultaneous fit. If considering only this systemic component, the CO SLED looks much less extreme, and in agreement with subthermal excitation conditions. Nonetheless, since the data analyzed in this work does not allow us to determine the origin of the velocity offset observed in the CO(7−6) spectrum, and for consistency with the other sources, we use the modeling results obtained by considering the CO SLED that uses the total velocity-integrated CO fluxes.
Current usage metrics show cumulative count of Article Views (full-text article views including HTML views, PDF and ePub downloads, according to the available data) and Abstracts Views on Vision4Press platform.
Data correspond to usage on the plateform after 2015. The current usage metrics is available 48-96 hours after online publication and is updated daily on week days.
Initial download of the metrics may take a while.