Fig. 1.
Download original image
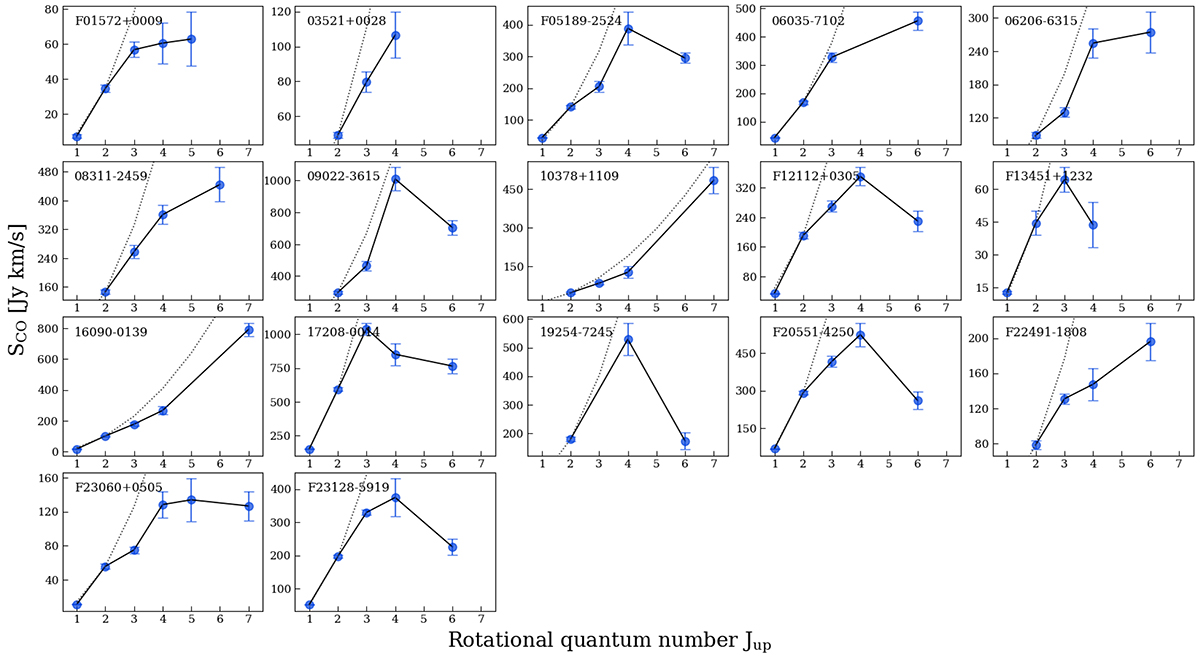
CO spectral line energy distributions of the ULIRGs in our sample. The blue circles with the error bars are the velocity-integrated line fluxes in units of Jy km s−1. The dotted gray lines show the thermalized, optically thick limit (in all lines), SLED profiles, normalized to the CO(2−1) transition (which is the lowest-J CO transition that is available for all sources). The source IDs are reported on the top-left corner of each panel.
Current usage metrics show cumulative count of Article Views (full-text article views including HTML views, PDF and ePub downloads, according to the available data) and Abstracts Views on Vision4Press platform.
Data correspond to usage on the plateform after 2015. The current usage metrics is available 48-96 hours after online publication and is updated daily on week days.
Initial download of the metrics may take a while.