Fig. 7
Download original image
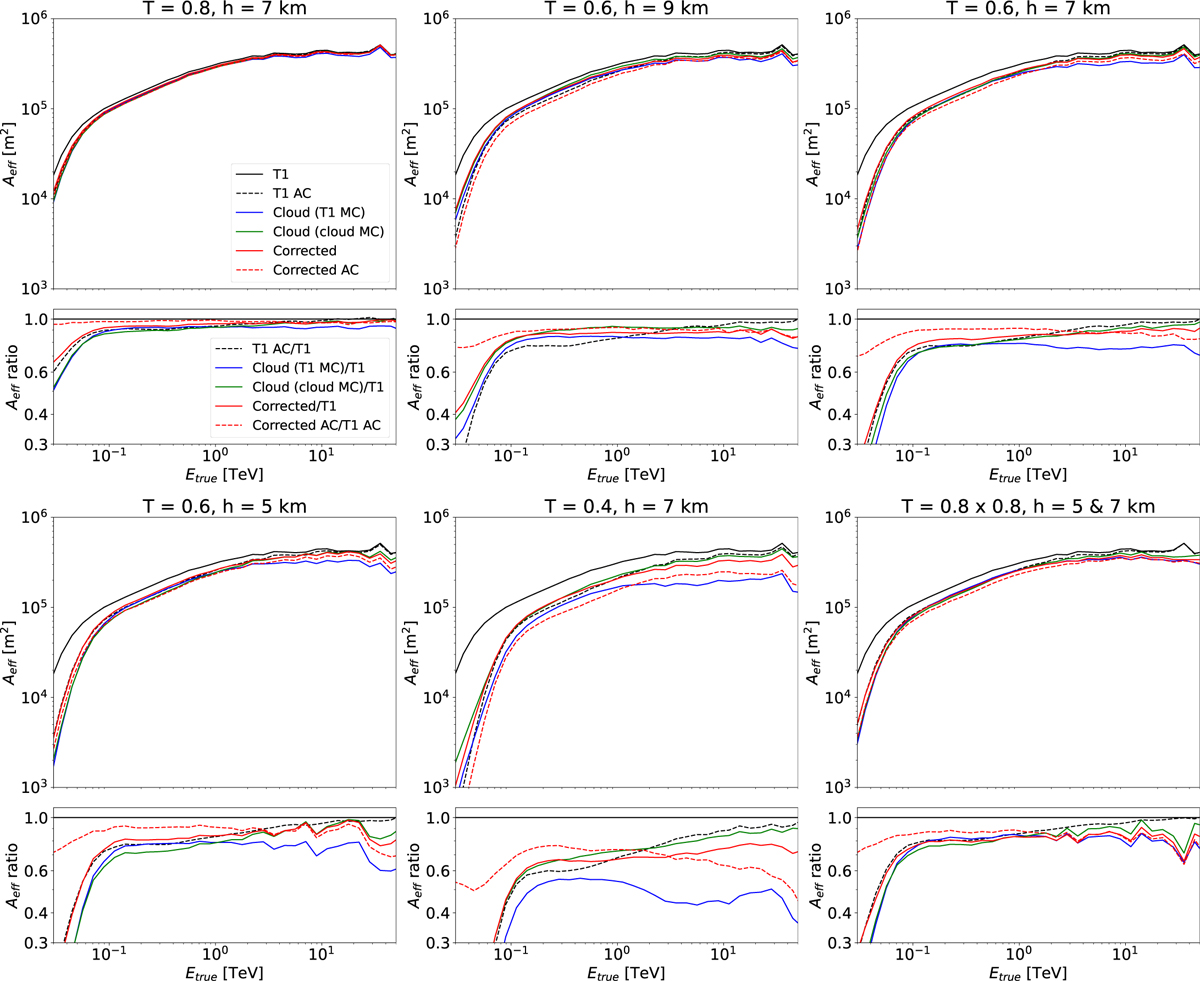
Collection area for gamma rays, expressed as a function of the true energy. Black lines: Cloudless condition (T1). Blue: cloudy data analysed with cloudless MC simulations. Green: Cloud analysed with dedicated MC simulations. Red: image-correction method analysed with general cloudless MC simulations. Dashed lines show the results with an additional cleaning (AC). Different panels show different transmission, T, and base height, h, of the cloud. Efficiency cuts in gammaness (90%) and θ2 (70%) are applied. The second and fourth rows of subpanels show selected ratios of the collection areas shown in the first and third rows (see legend).
Current usage metrics show cumulative count of Article Views (full-text article views including HTML views, PDF and ePub downloads, according to the available data) and Abstracts Views on Vision4Press platform.
Data correspond to usage on the plateform after 2015. The current usage metrics is available 48-96 hours after online publication and is updated daily on week days.
Initial download of the metrics may take a while.