Fig. 5
Download original image
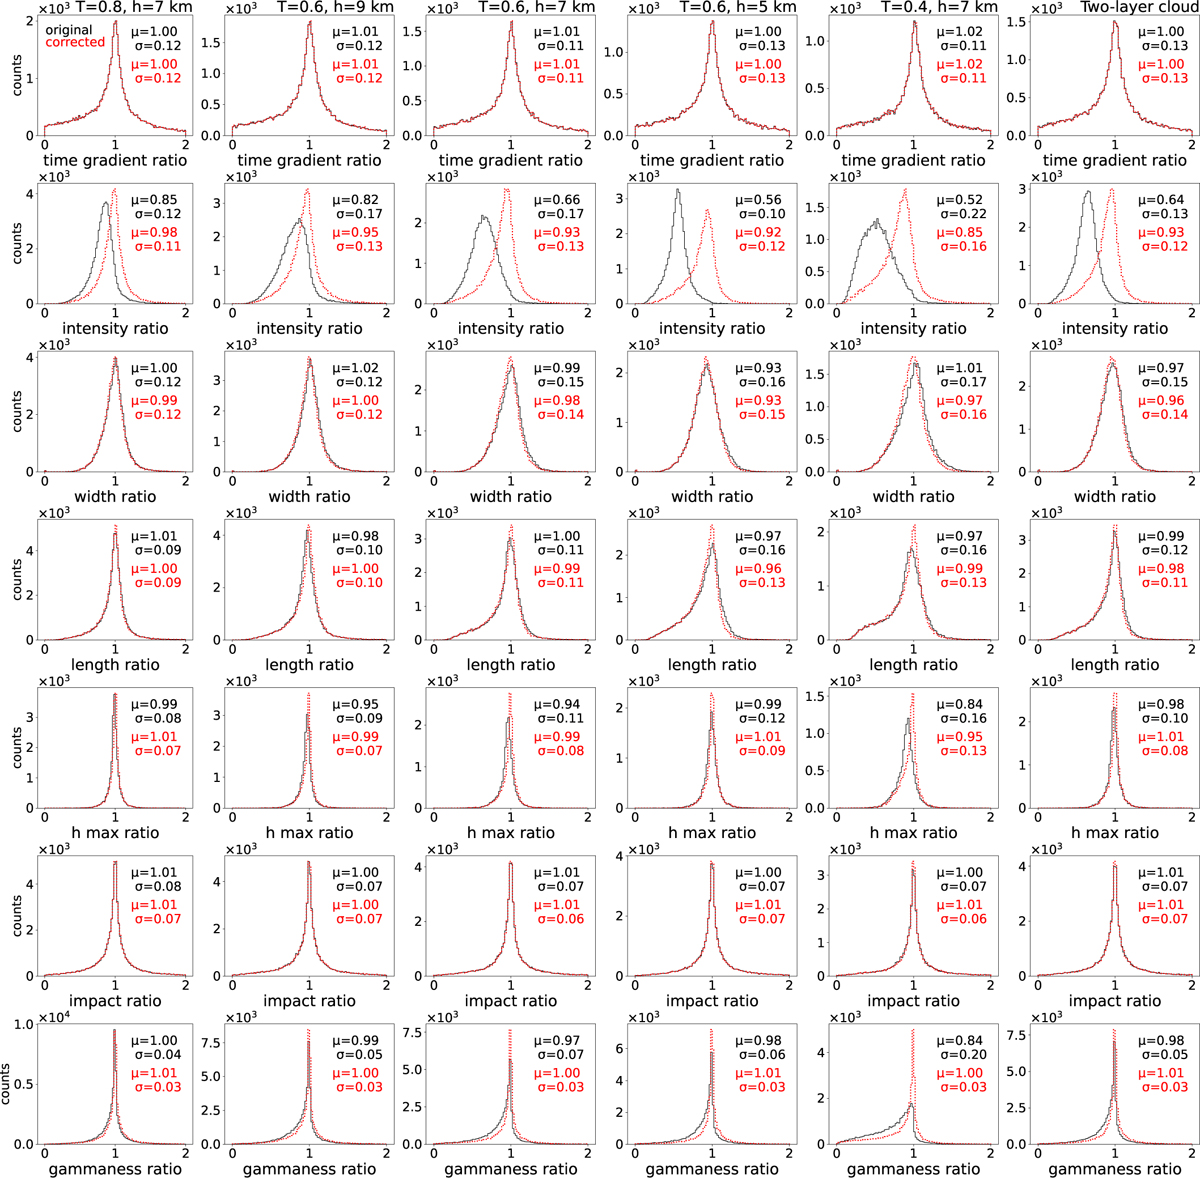
Comparison of the ratios of the image and the stereoscopic parameters simulated with cloud presence (without correction in solid black lines and with correction but without redoing the cleaning in red dotted lines) to the same parameters simulated in the cloudless sky. Different rows show different parameters. From top to bottom: time gradient measured along the main axis of the image, Intensity, Width, Length, height of the shower maximum, impact parameter, and gammaness. Different columns report different cloud heights a.g.l. and transmissions, from left to right: T = 0.8, h = 7 km; T = 0.6, h = 9 km; T = 0.6, h = 7 km; T = 0.6, h = 5 km; T = 0.4, h = 7 km; and two-layer cloud. In each panel, the bias and spread are reported as the mean, μ, and standard deviation, σ, of a Gaussian fitted to the distribution of the ratios.
Current usage metrics show cumulative count of Article Views (full-text article views including HTML views, PDF and ePub downloads, according to the available data) and Abstracts Views on Vision4Press platform.
Data correspond to usage on the plateform after 2015. The current usage metrics is available 48-96 hours after online publication and is updated daily on week days.
Initial download of the metrics may take a while.