Fig. 4
Download original image
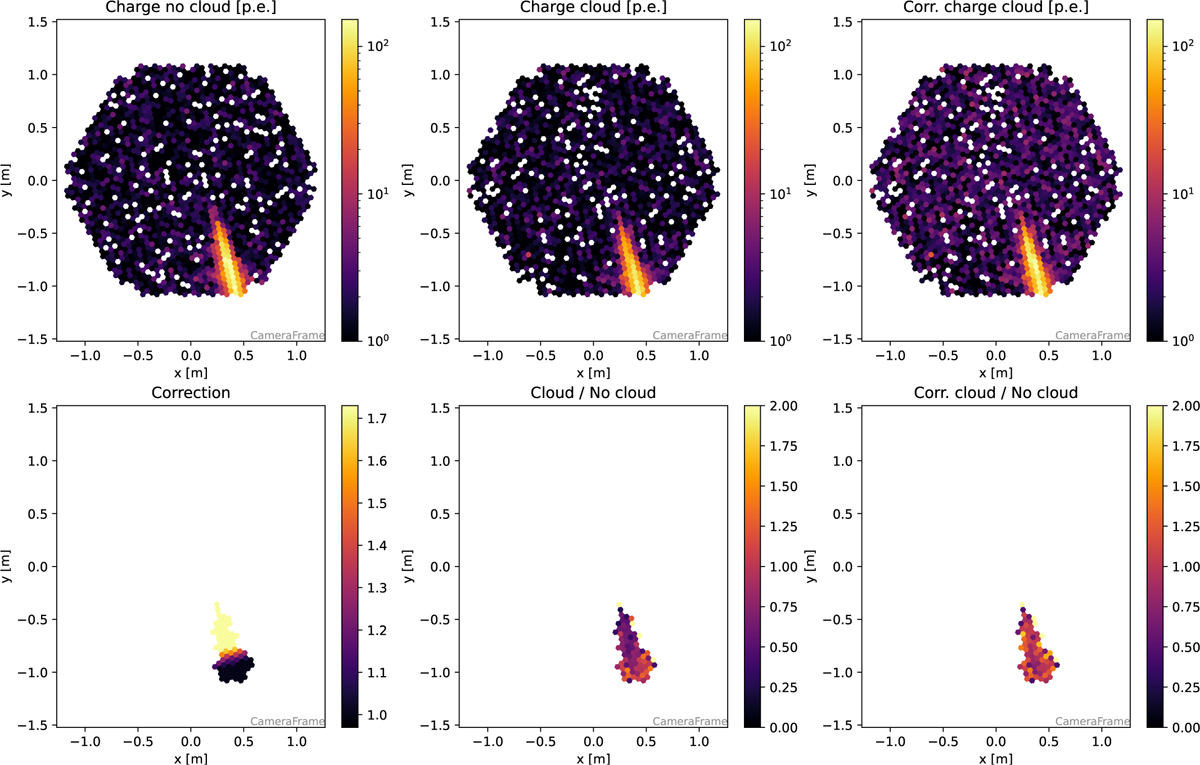
Example of the image correction for the attenuation of light in a cloud. A cloud with a base height of 7 km a.g.1., a thickness of 1 km, and transmission of 0.6 is simulated. The top-left panel shows the shower image with cloudless observations, the top-middle panel shows the same shower simulated with additional light attenuation in the cloud, and the top-right shows the corrected image. The bottom-left panel shows the correction factor applied, the bottom-middle panel shows the ratio of the reconstructed signals of the uncorrected image to those of a cloudless image and the bottom-right panel shows the same ratio but between corrected and cloudless images. For clarity, only pixels surviving the cleaning for the case of observation with the cloud are shown in the bottom panels. The ‘head’ of the shower is in the top part of its image.
Current usage metrics show cumulative count of Article Views (full-text article views including HTML views, PDF and ePub downloads, according to the available data) and Abstracts Views on Vision4Press platform.
Data correspond to usage on the plateform after 2015. The current usage metrics is available 48-96 hours after online publication and is updated daily on week days.
Initial download of the metrics may take a while.