Open Access
Fig. 8
Download original image
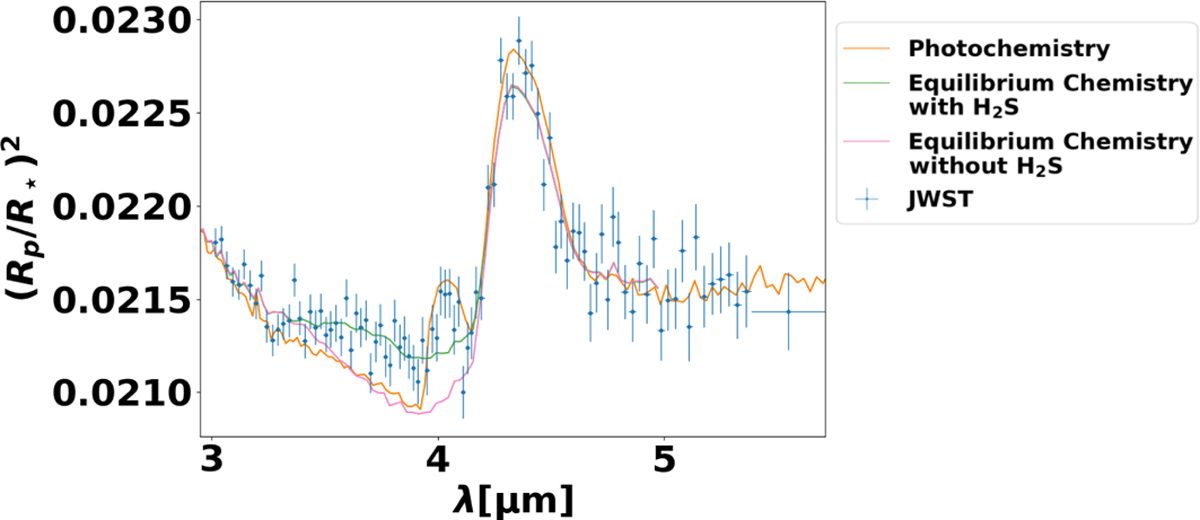
Comparison between the fitted spectra for three different scenarios. Pink shows the modeled spectra for an atmosphere governed by equilibrium chemistry with no H2S. The green shows an atmosphere governed by equilibrium chemistry with H2S. Orange shows the spectra for an atmosphere impacted by photochemistry.
Current usage metrics show cumulative count of Article Views (full-text article views including HTML views, PDF and ePub downloads, according to the available data) and Abstracts Views on Vision4Press platform.
Data correspond to usage on the plateform after 2015. The current usage metrics is available 48-96 hours after online publication and is updated daily on week days.
Initial download of the metrics may take a while.