Fig. 1
Download original image
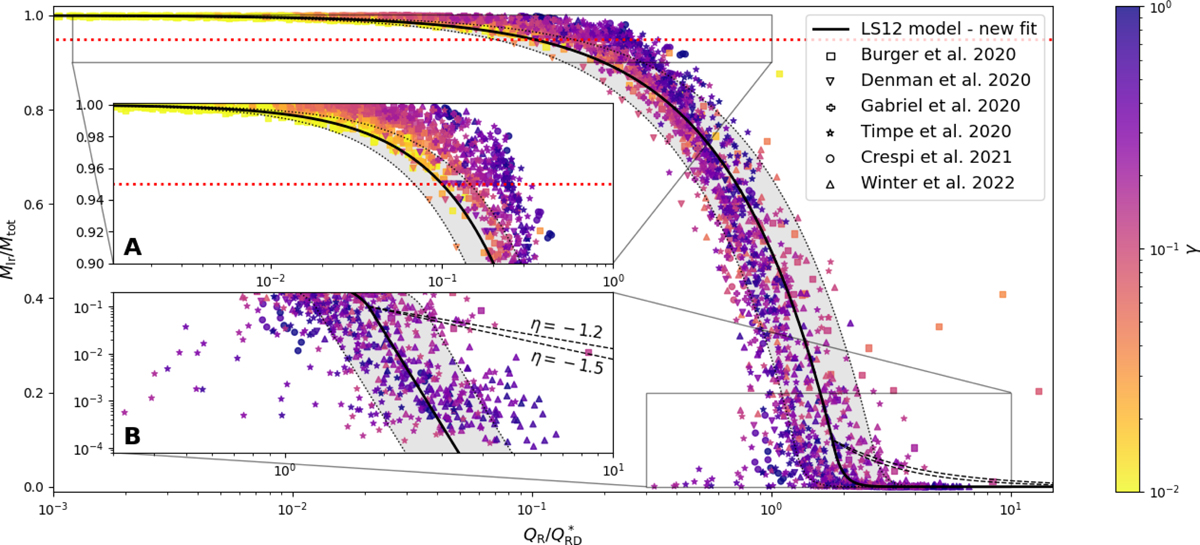
Scaled mass of the largest remnant (Mlr/Mtot) with respect to the impact energy scaled by the catastrophic disruption criterion (QR/![]() ). The six datasets used in this study are represented with different symbols: square for data from Burger et al. (2020), upside–down triangle for data from Denman et al. (2020), plus symbol for data from Gabriel et al. (2020), star symbold for Timpe et al. (2020), circles for data from Crespi et al. (2021), and triangles for data from Winter et al. (2023). The colours denote the mass ratio γ. The black line corresponds to the universal law (Eq. (1)) and the gray area represent the dispersion δ. The range of possible slope η from LS12 is represented with dashed lines in the super-catastrophic regime. The most crowded regions are zoomed in the panels A (merging regime) and B (super-catastrophic regime). The region above the red dotted line at Mlr/Mtot = 0.95 is not included in the MCMC analysis.
). The six datasets used in this study are represented with different symbols: square for data from Burger et al. (2020), upside–down triangle for data from Denman et al. (2020), plus symbol for data from Gabriel et al. (2020), star symbold for Timpe et al. (2020), circles for data from Crespi et al. (2021), and triangles for data from Winter et al. (2023). The colours denote the mass ratio γ. The black line corresponds to the universal law (Eq. (1)) and the gray area represent the dispersion δ. The range of possible slope η from LS12 is represented with dashed lines in the super-catastrophic regime. The most crowded regions are zoomed in the panels A (merging regime) and B (super-catastrophic regime). The region above the red dotted line at Mlr/Mtot = 0.95 is not included in the MCMC analysis.
Current usage metrics show cumulative count of Article Views (full-text article views including HTML views, PDF and ePub downloads, according to the available data) and Abstracts Views on Vision4Press platform.
Data correspond to usage on the plateform after 2015. The current usage metrics is available 48-96 hours after online publication and is updated daily on week days.
Initial download of the metrics may take a while.