Fig. 3.
Download original image
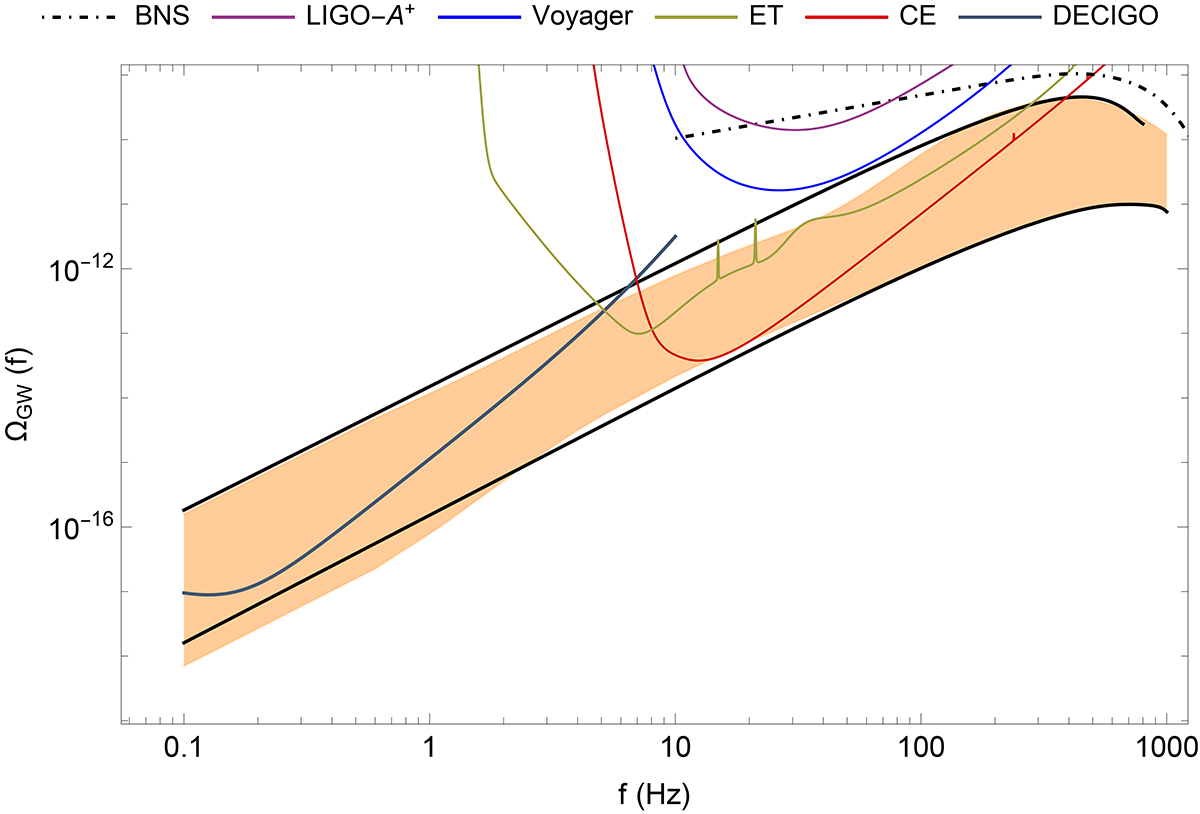
Total contribution to the SGWB from weakly hyperbolic encounters (orange area). In this plot, the virial velocity varies within 5 km s−1 ≤ vi ≤ 18 km s−1. The black lines around the orange area show the fitted curves for this SGWB; the bottom line represents the pessimistic scenario, while the top line is the optimistic scenario (see Sect. 4.2 for more details). Moreover, BNS, LIGO-A+, and Voyager curves correspond to the energy density of GW background of the binary neutron star (Abbott et al. 2023), and the sensitivity curves of the Advanced Laser Interferometer Gravitational-wave Observatory (Mishra et al. 2010), and the Voyager (Abbott et al. 2017; Sathyaprakash et al. 2019; see also (LIGO Scientific Collaboration et al. 2021)) detectors respectively for one year of observations.
Current usage metrics show cumulative count of Article Views (full-text article views including HTML views, PDF and ePub downloads, according to the available data) and Abstracts Views on Vision4Press platform.
Data correspond to usage on the plateform after 2015. The current usage metrics is available 48-96 hours after online publication and is updated daily on week days.
Initial download of the metrics may take a while.