Fig. 4.
Download original image
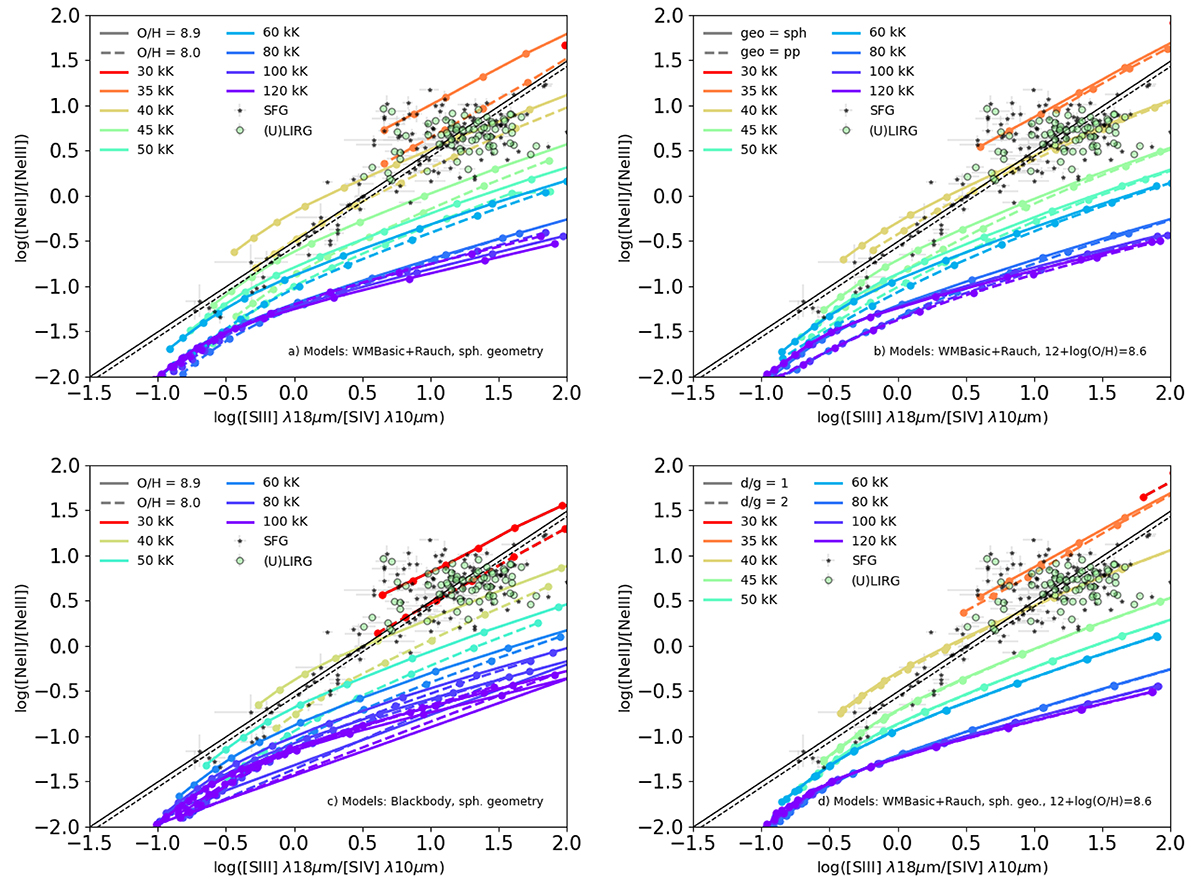
Infrared softness diagram based on the emission-line ratios [Ne II] λ 12.8 μm/[Ne III] λ 15.6 μm and [S III] λ 18.7 μm /[S IV] λ 10.5 μm for the sample of objects described in the text: star-forming galaxies (black stars) and (U)LIRGs (green circles). The black solid and dashed lines represent the mean values of the ![]() parameter for SFGs and (U)LIRGs, respectively. Shown in each panel are the sequences of models for different values of T* with different conditions to be compared with the data, including: a) Models calculated with WM-Basic (Pauldrach et al. 2001) massive stars (from 30 to 60 kK) and Rauch (2003) central stars of PNe (from 80 to 120 kK) assuming a spherical geometry. The solid lines represent models with 12 + log(O/H) = 8.9, while the dashed lines represent a value of 8.0. b) WM-Basic and Rauch models with 12 + log(O/H) = 8.6 with spherical (solid line) and plane-parallel (dashed) geometry. c) Models calculated assuming a black-body incident continuum from 30 kK up to 100 kK assuming spherical geometry with 12 + log(O/H) = 8.9 (solid line) and 8.0 (dashed line). d) Models using WM-Basic and Rauch stellar atmospheres with spherical geometry and 12 + log(O/H) = 8.6, and a standard value for the dust-to-gas mass ratio (solid line), and with a doubled dust content (dashed line).
parameter for SFGs and (U)LIRGs, respectively. Shown in each panel are the sequences of models for different values of T* with different conditions to be compared with the data, including: a) Models calculated with WM-Basic (Pauldrach et al. 2001) massive stars (from 30 to 60 kK) and Rauch (2003) central stars of PNe (from 80 to 120 kK) assuming a spherical geometry. The solid lines represent models with 12 + log(O/H) = 8.9, while the dashed lines represent a value of 8.0. b) WM-Basic and Rauch models with 12 + log(O/H) = 8.6 with spherical (solid line) and plane-parallel (dashed) geometry. c) Models calculated assuming a black-body incident continuum from 30 kK up to 100 kK assuming spherical geometry with 12 + log(O/H) = 8.9 (solid line) and 8.0 (dashed line). d) Models using WM-Basic and Rauch stellar atmospheres with spherical geometry and 12 + log(O/H) = 8.6, and a standard value for the dust-to-gas mass ratio (solid line), and with a doubled dust content (dashed line).
Current usage metrics show cumulative count of Article Views (full-text article views including HTML views, PDF and ePub downloads, according to the available data) and Abstracts Views on Vision4Press platform.
Data correspond to usage on the plateform after 2015. The current usage metrics is available 48-96 hours after online publication and is updated daily on week days.
Initial download of the metrics may take a while.