Fig. 3
Download original image
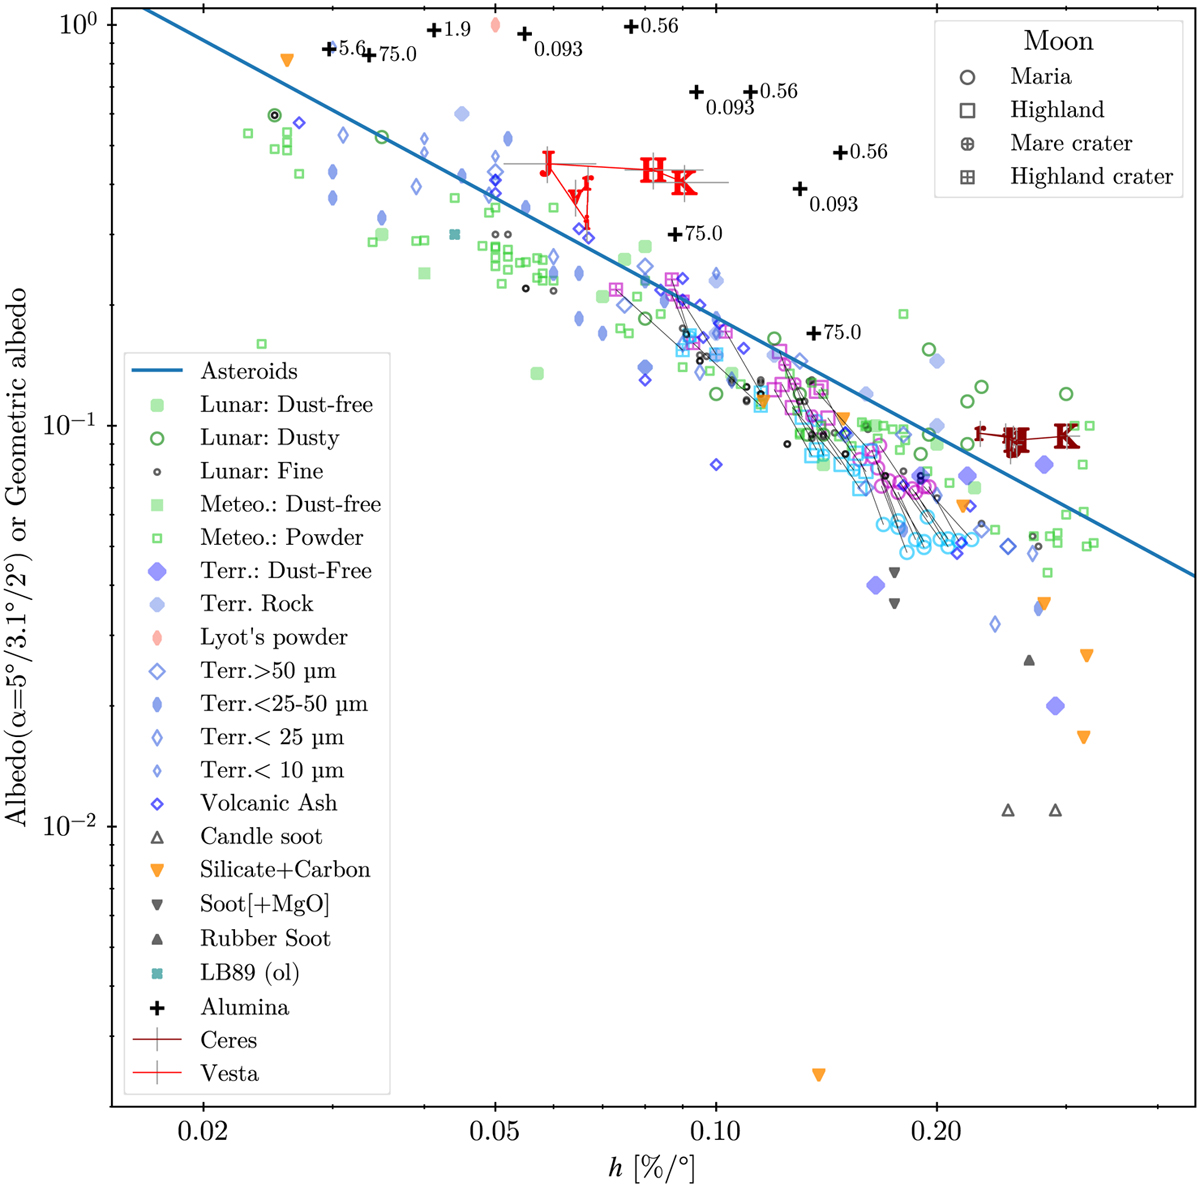
Slope (h)-albedo relation. See Sect. 2 and Table 1 for the details of the laboratory data and their original sources. The numbers next to the alumina samples are the D/λ values. The telescopic lunar observation data from Shkuratov et al. (1992) are shown for blue (0.42 µm) and red (0.65 µm) wavelengths using cyan and magenta colors, respectively, and the same regions are connected by a thin line. The lunar albedo is defined at α = 3.1°, so it should be smaller than the geometric albedo. The blue solid line is the regression line for asteroids (Lupishko 2018). The Ceres and Vesta results are shown as red and dark red, respectively, and are connected in the order of increasing wavelength: υ = 0.45–0.60 µm, r = 0.60–0.75 µm, i = 0.75−1.0 µm, J-, H-, and K-bands (Paper II).
Current usage metrics show cumulative count of Article Views (full-text article views including HTML views, PDF and ePub downloads, according to the available data) and Abstracts Views on Vision4Press platform.
Data correspond to usage on the plateform after 2015. The current usage metrics is available 48-96 hours after online publication and is updated daily on week days.
Initial download of the metrics may take a while.