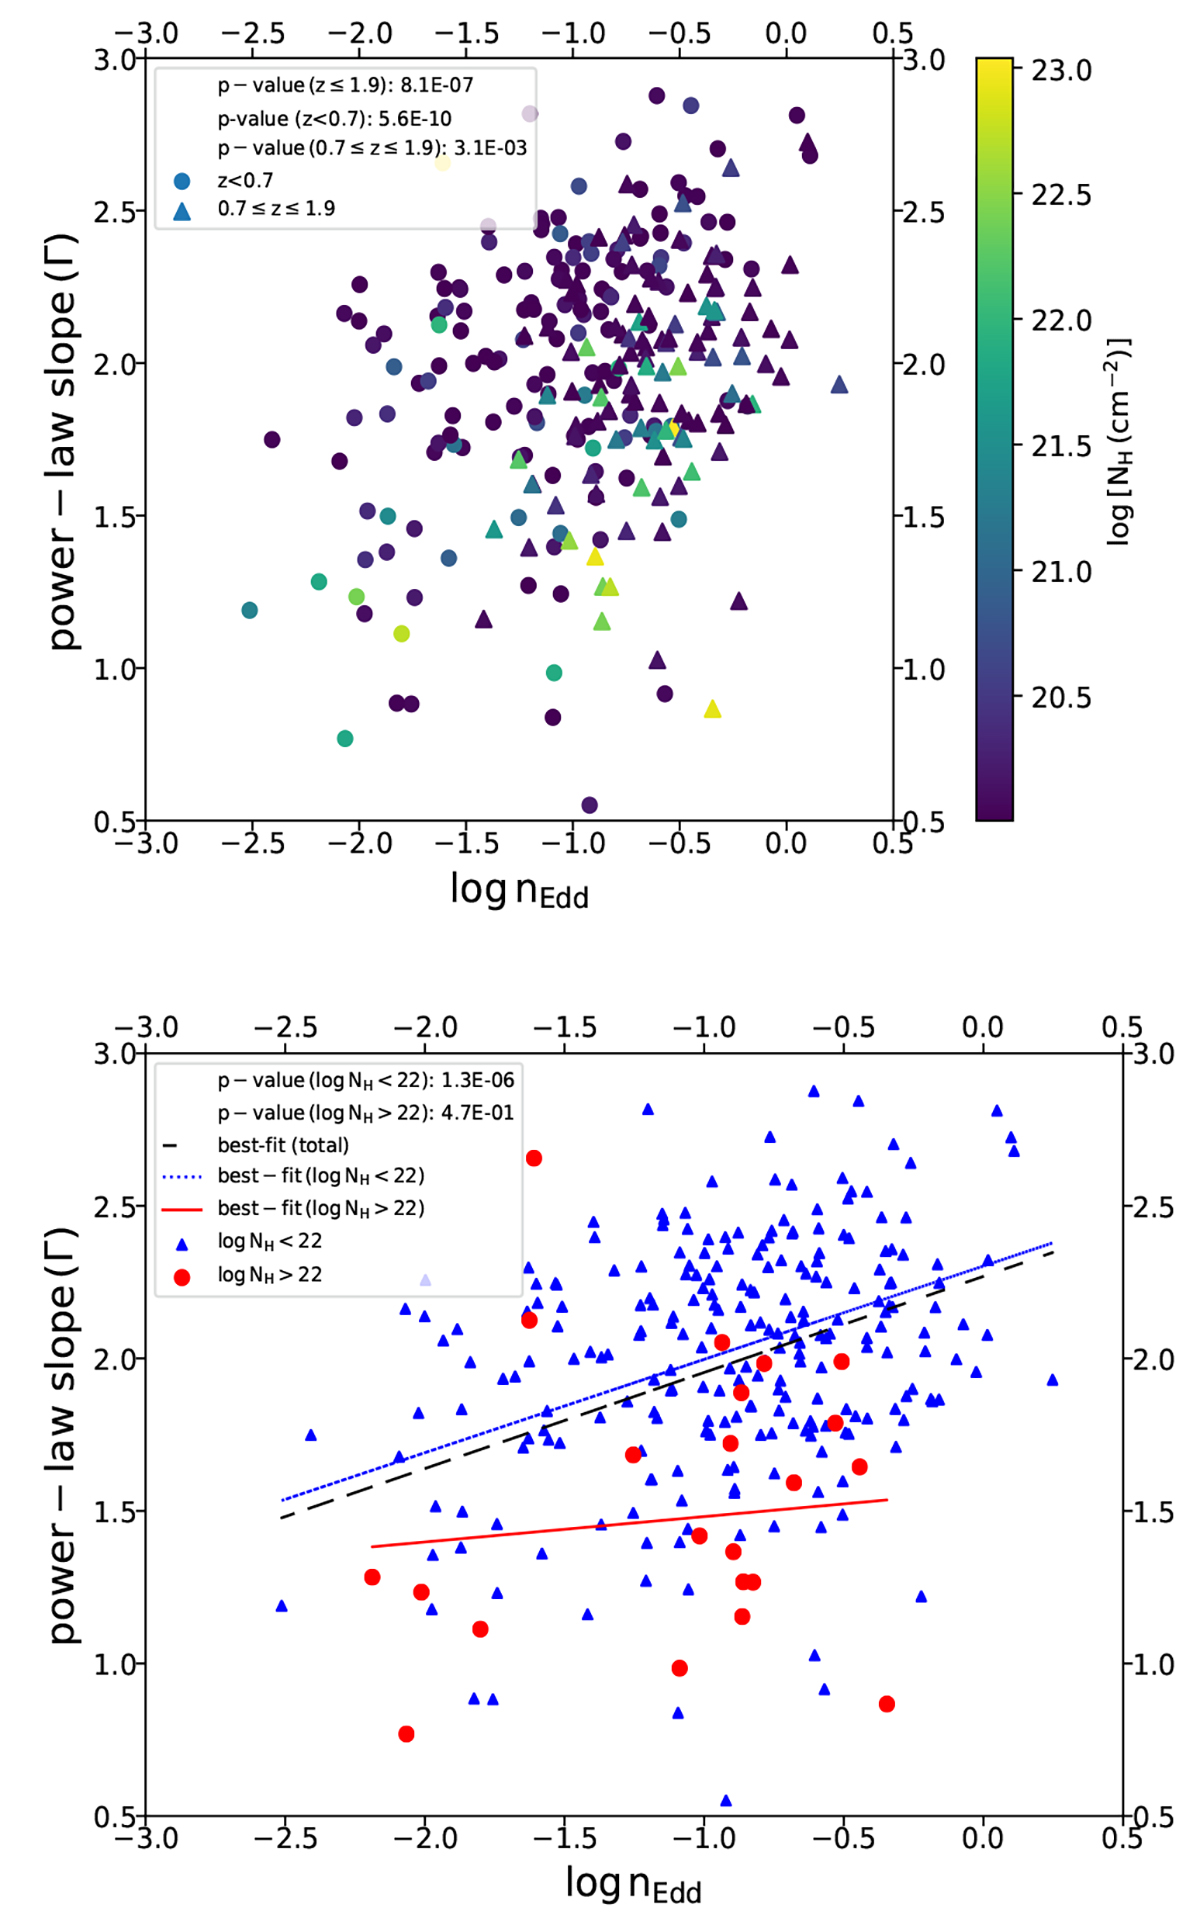
Fig. 14.
Download original image
Spectral photon index, Γ, as a function of nEdd. In the top panel, different symbols correspond to different redshift intervals, as indicated in the legend. The results are colour-coded based on the NH values of the sources. The p-values obtained by applying a Spearman correlation analysis are shown in the legend. The bottom panel shows the same relation but for X-ray AGN with NH > 1022 cm−2 (red circles) and AGN with NH < 1022 cm−2 (blue triangles). The p-values for the Γ − nEdd correlation for each AGN population are presented in the legend of the plot. The different lines correspond to the best fits using the total AGN sample (black dashed line), AGN with NH > 1022 cm−2 (red solid line), and AGN with NH < 1022 cm−2 (blue line).
Current usage metrics show cumulative count of Article Views (full-text article views including HTML views, PDF and ePub downloads, according to the available data) and Abstracts Views on Vision4Press platform.
Data correspond to usage on the plateform after 2015. The current usage metrics is available 48-96 hours after online publication and is updated daily on week days.
Initial download of the metrics may take a while.