Fig. A.1
Download original image
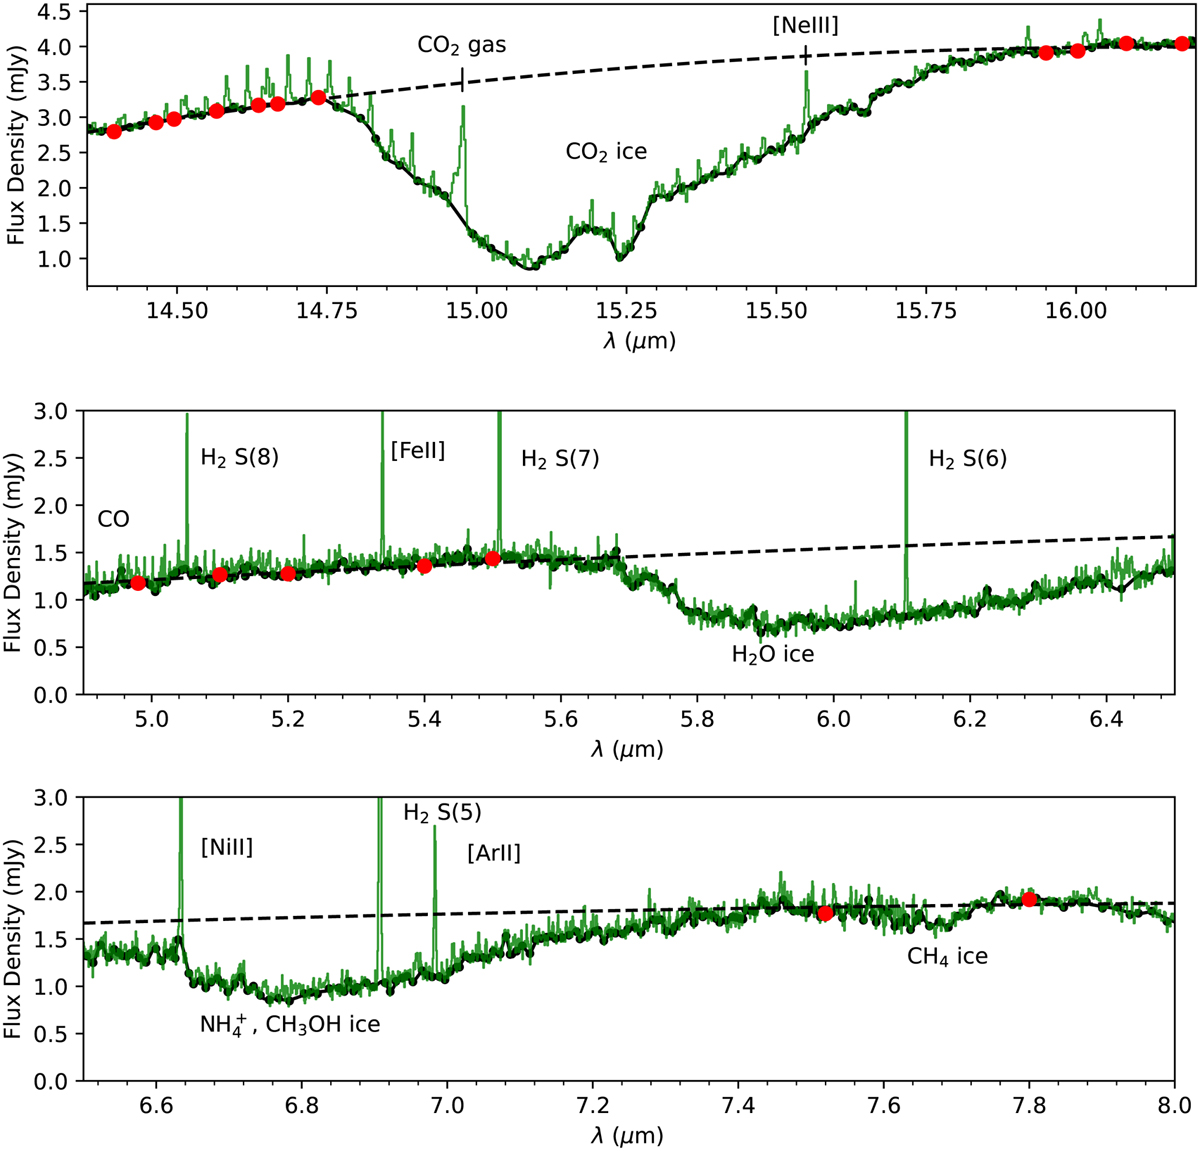
Example of local continuum spline fitting and modelling of the CO2 (top panel), H2O (middle panel), and ![]() (bottom panel) ice absorption feature’s optical depth. The dashed line shows the model for the thermal continuum fit to red points on either side of the ice feature, while the solid black line indicates the cubic spline fit. The data is shown in green for source A. The majority of unlabelled emission features in the lower panel are H2O emission.
(bottom panel) ice absorption feature’s optical depth. The dashed line shows the model for the thermal continuum fit to red points on either side of the ice feature, while the solid black line indicates the cubic spline fit. The data is shown in green for source A. The majority of unlabelled emission features in the lower panel are H2O emission.
Current usage metrics show cumulative count of Article Views (full-text article views including HTML views, PDF and ePub downloads, according to the available data) and Abstracts Views on Vision4Press platform.
Data correspond to usage on the plateform after 2015. The current usage metrics is available 48-96 hours after online publication and is updated daily on week days.
Initial download of the metrics may take a while.