Fig. 7
Download original image
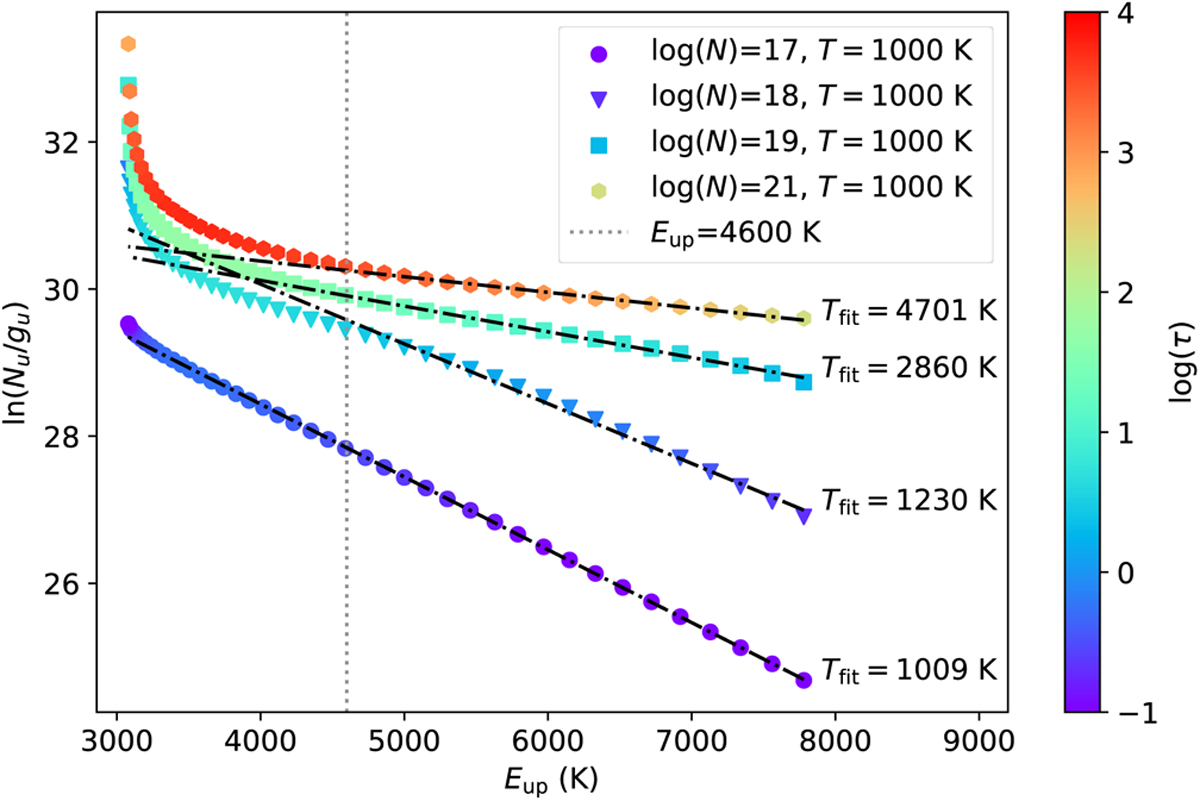
Rotational diagrams of CO υ = 1 − 0 P-branch transitions produced using our LTE slab model for four different column densities at a temperature of T = 1000 K; the colour of each symbol indicates the line optical depth. The dotted line at Eup = 4600 K is the energy above which transitions fall shortwards of the MIRI/MRS blue wavelength limit of 4.9 µm. For each model, the rotational temperature derived from a linear fit to transitions in the MIRI range (i.e. above Eup = 4600 K) is shown by the black lines.
Current usage metrics show cumulative count of Article Views (full-text article views including HTML views, PDF and ePub downloads, according to the available data) and Abstracts Views on Vision4Press platform.
Data correspond to usage on the plateform after 2015. The current usage metrics is available 48-96 hours after online publication and is updated daily on week days.
Initial download of the metrics may take a while.