Fig. 6
Download original image
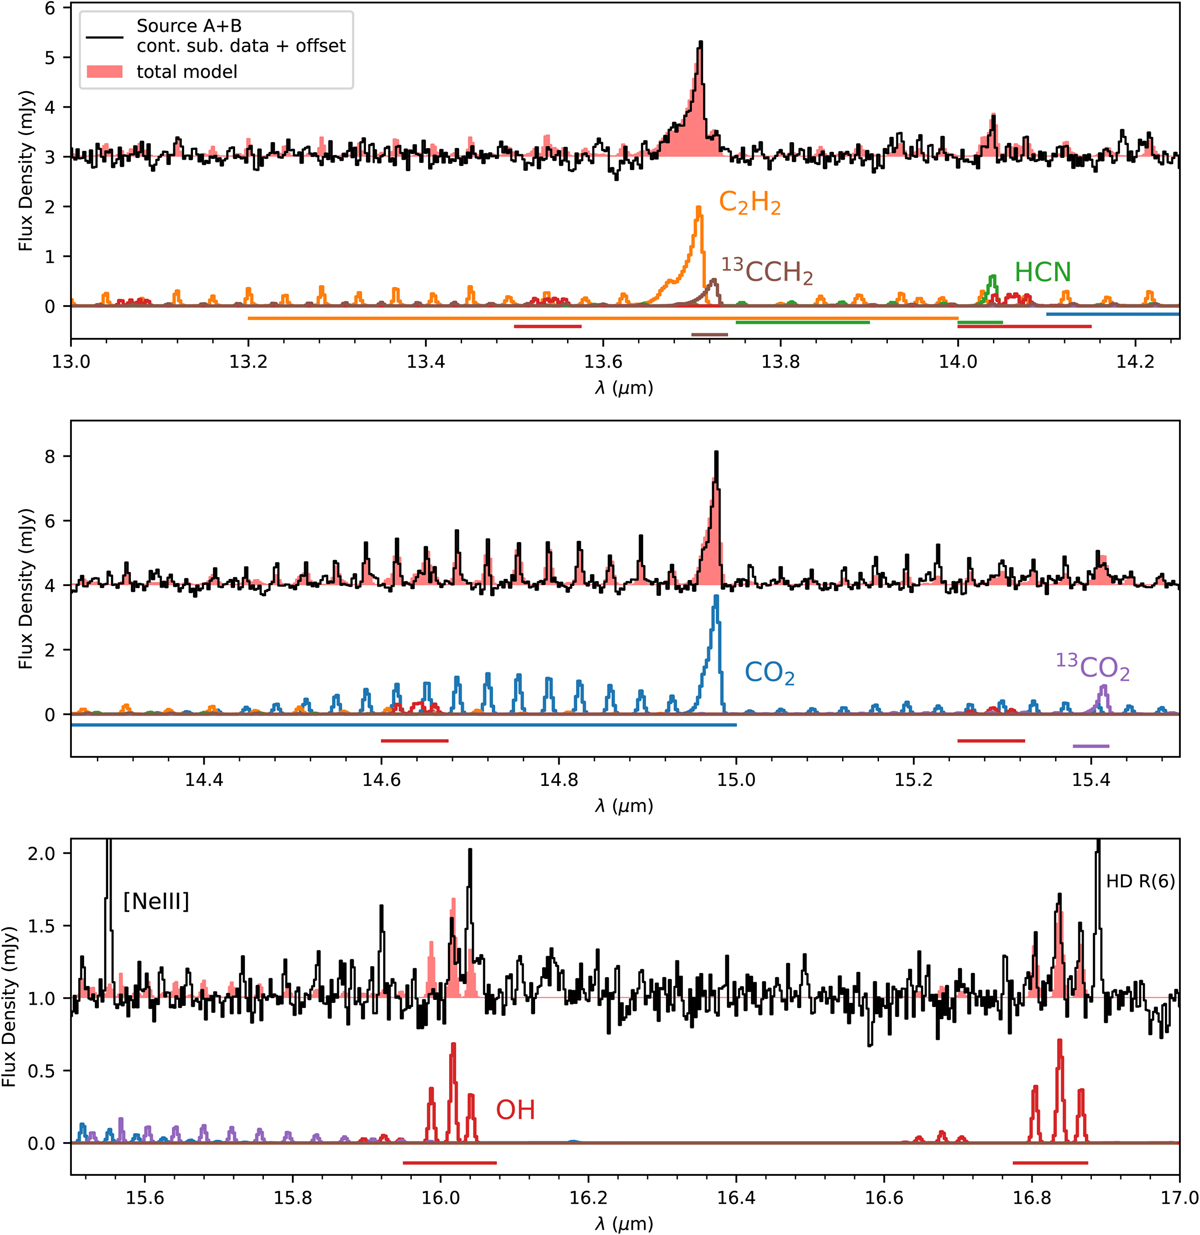
Combined best-fit LTE model for 12CO2, 13CO2, C2H2, 13CCH2, HCN, and OH emission in source A+B (red shaded region) overlaid on the continuum subtracted data with an arbitrary flux offset (black). Prominent emission lines are labelled. Best-fit results for individual molecules are shown as the coloured lines below, with the horizontal bars indicating the regions of spectrum used for fitting. Extinction by CO2 ice has been included in the models, which suppresses the flux from the CO2 gas P-branch (see Sect. 2.4).
Current usage metrics show cumulative count of Article Views (full-text article views including HTML views, PDF and ePub downloads, according to the available data) and Abstracts Views on Vision4Press platform.
Data correspond to usage on the plateform after 2015. The current usage metrics is available 48-96 hours after online publication and is updated daily on week days.
Initial download of the metrics may take a while.