Fig. 2
Download original image
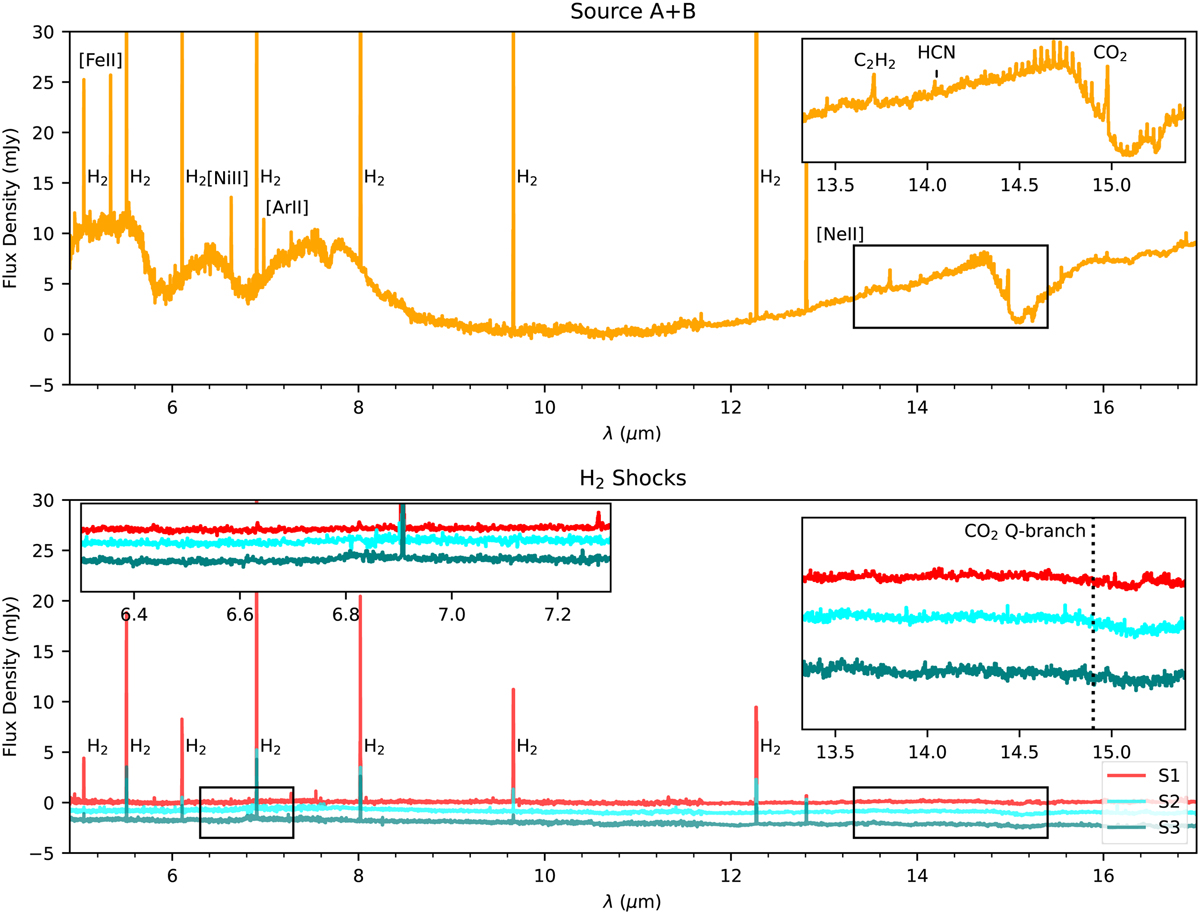
Spectra of sources A+B (top panel) and the brightest H2 knots (lower panel) extracted from the apertures shown in Fig. 1. Flux offsets of −2.5 and −5.0 mJy are applied to the spectra of S2 and S3 respectively. In contrast with the A+B spectrum, no molecular lines other than H2, CO, and OH in S1 are detected towards the H2 knots.
Current usage metrics show cumulative count of Article Views (full-text article views including HTML views, PDF and ePub downloads, according to the available data) and Abstracts Views on Vision4Press platform.
Data correspond to usage on the plateform after 2015. The current usage metrics is available 48-96 hours after online publication and is updated daily on week days.
Initial download of the metrics may take a while.