Fig. A.2
Download original image
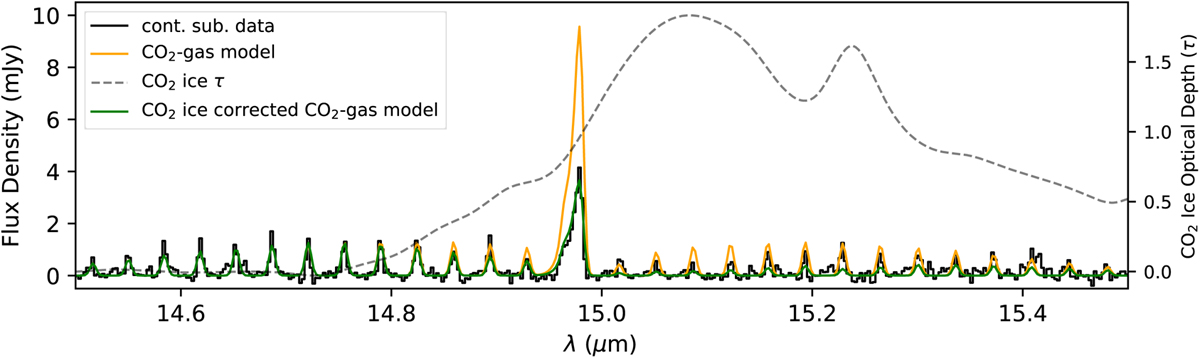
Correction for differential extinction by CO2 ice of the CO2 gas emission features. The blue line shows the continuum subtracted data with the CO2 ice feature removed. The best-fit LTE model of CO2 with extinction correction, but without any correction for ice absorption (orange) overproduces the Q and P-branch emission. The estimated optical depth of the CO2 ice feature (dashed grey line) is applied as a scaling factor to the same best-fit model (green curve), which significantly improves the fit to the Q-branch, though the P-branch features are now somewhat under-produced.
Current usage metrics show cumulative count of Article Views (full-text article views including HTML views, PDF and ePub downloads, according to the available data) and Abstracts Views on Vision4Press platform.
Data correspond to usage on the plateform after 2015. The current usage metrics is available 48-96 hours after online publication and is updated daily on week days.
Initial download of the metrics may take a while.