Fig. 1
Download original image
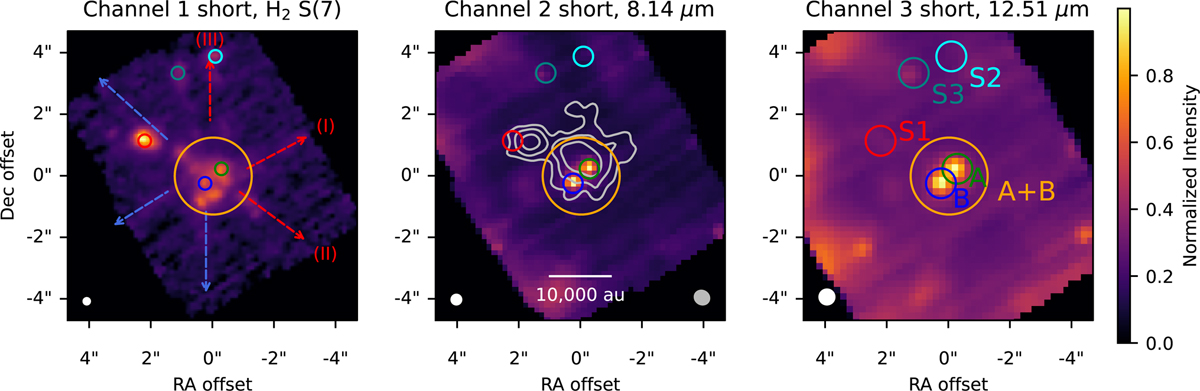
First three channels of MIRI/MRS observations of IRAS 23385+6053. The left panel shows the H2 S(7) transition in channel 1 at 5.511 µm, while the centre and right panels show the averaged continuum in channels 2 and 3. The colour scale in all panels is normalized to the peak intensity. The arrows in the left panel indicate the directions and velocity shift of the major outflows proposed by Beuther et al. (2023). The extraction apertures for our spectra are shown in each panel by the coloured circles. Aperture A+B has a constant radius of 2.5", while all other apertures have aradius that scales with wavelength as r = 2(1.22λ/6.5 m). The grey contours overlaid on channel 2 are 1.3 mm continuum emission (Gieser et al. 2021). The white circle in the bottom left indicates the mean beam size of JWST in the given channel, while the grey ellipse in the second panel indicates the FWHM of the mm beam.
Current usage metrics show cumulative count of Article Views (full-text article views including HTML views, PDF and ePub downloads, according to the available data) and Abstracts Views on Vision4Press platform.
Data correspond to usage on the plateform after 2015. The current usage metrics is available 48-96 hours after online publication and is updated daily on week days.
Initial download of the metrics may take a while.