Fig. 1.
Download original image
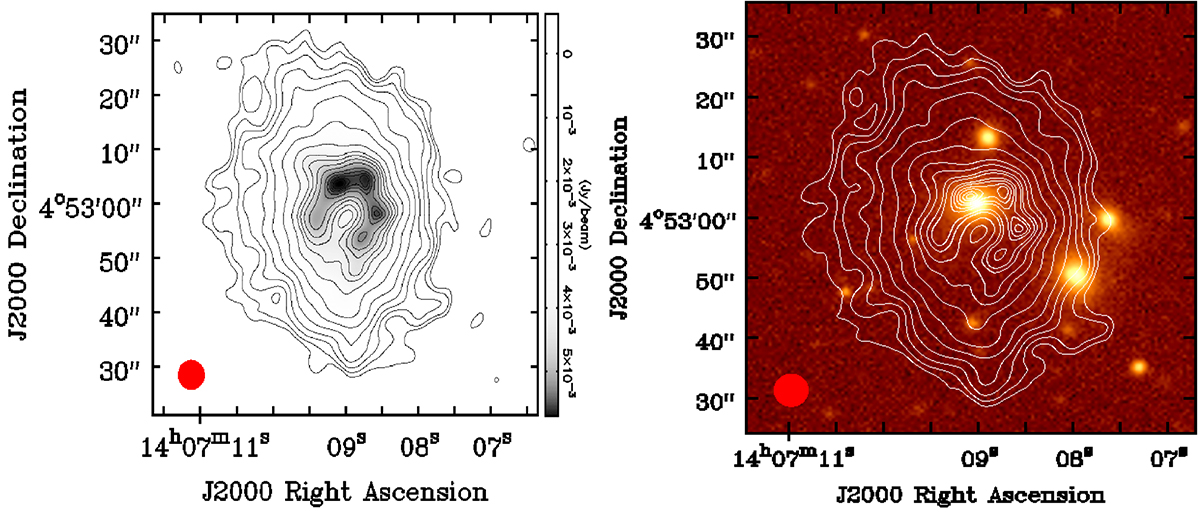
Left: J1407+0453 at 1400 MHz. The grey scale represents the flux density of the source. Right: J1407+0453 at 1400 MHz in a contour overlaid with the optical image taken from the 9th data release of the Dark Energy Spectroscopic Instrument’s Legacy Imaging Surveys (DESI LS DR9; Schlegel et al. 2021). For both images, the contour levels are at 3σ × (1, 1.4, 2, 2.8, 4, 5.7, 8, 10, 11, 12, 12.5, 13.2, 13.5, 13.8, 14, 14.2, 14.3, 15), where σ = 133 μJy beam−1 is the mean rms noise around the FIRST map.
Current usage metrics show cumulative count of Article Views (full-text article views including HTML views, PDF and ePub downloads, according to the available data) and Abstracts Views on Vision4Press platform.
Data correspond to usage on the plateform after 2015. The current usage metrics is available 48-96 hours after online publication and is updated daily on week days.
Initial download of the metrics may take a while.