Fig. 9
Download original image
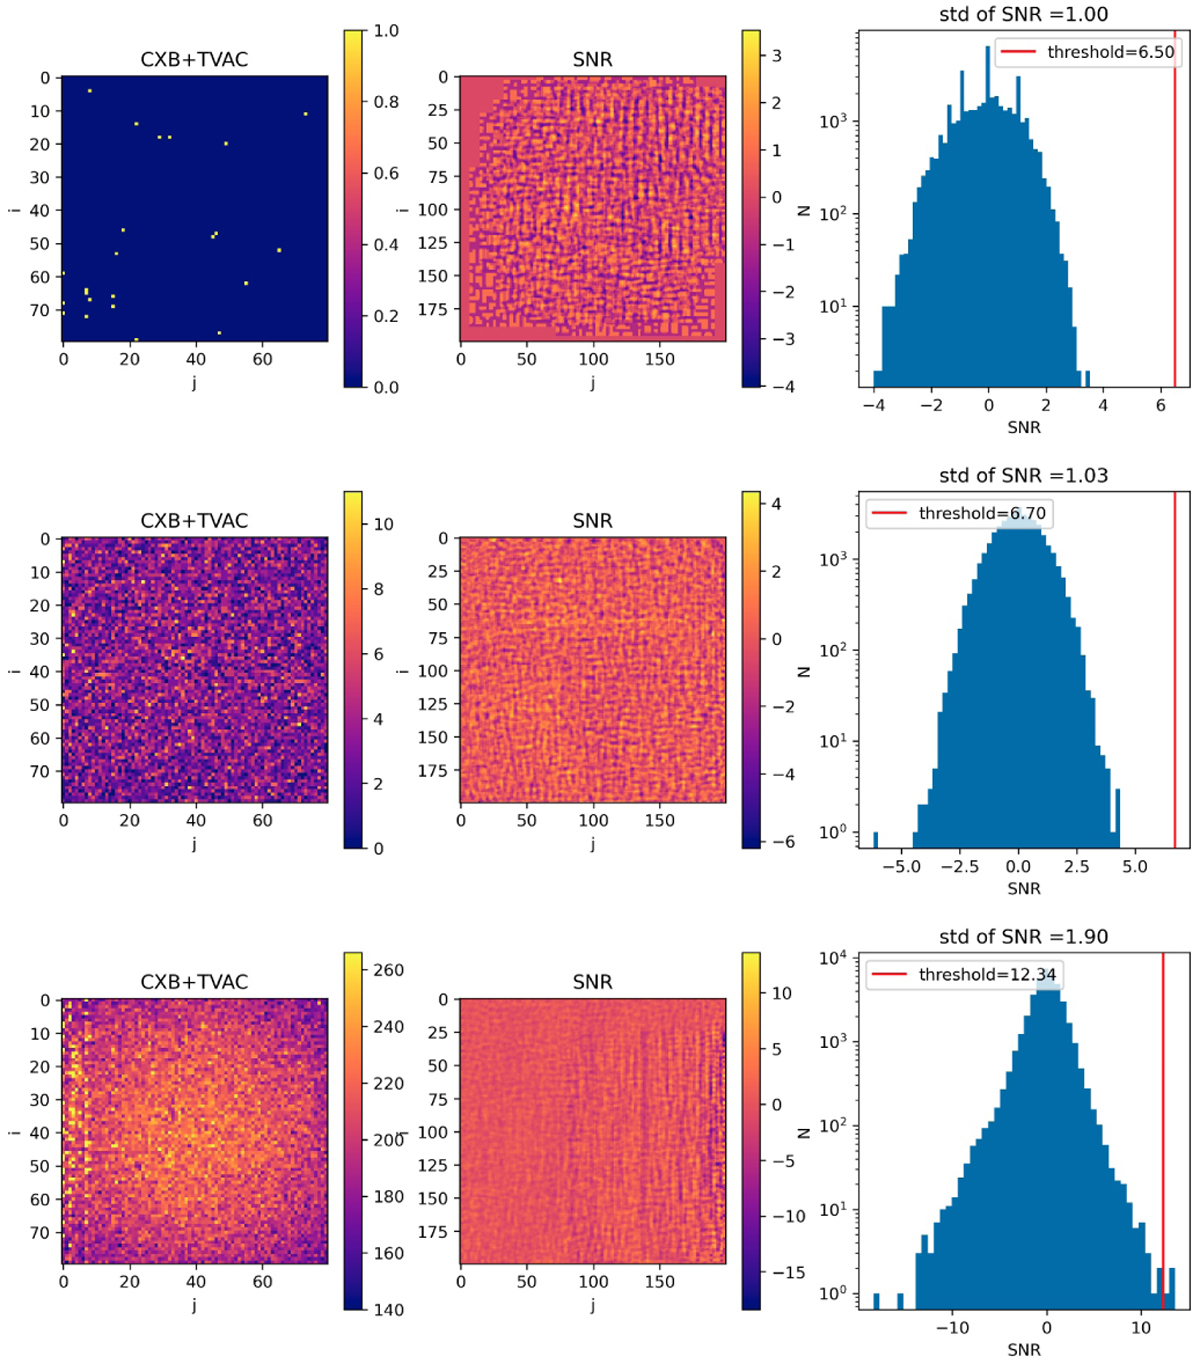
Simulation of the heat-pipe noise impact on ECLAIRs observations for different time scales in the 4–8 keV band (without correction for heat-pipe noise). From top to bottom: 10 ms, 20.48 s, and 1310.72 s observation simulations. The panels from left to right show the CXB plus TVAC count images, S/N sky maps, and histograms of S/N sky maps. The red line in the rightmost image is the trigger threshold, the trigger threshold of ECLAIRs equal to 6.5 σS/N (where σS/N is the standard deviation of each S/N histogram).
Current usage metrics show cumulative count of Article Views (full-text article views including HTML views, PDF and ePub downloads, according to the available data) and Abstracts Views on Vision4Press platform.
Data correspond to usage on the plateform after 2015. The current usage metrics is available 48-96 hours after online publication and is updated daily on week days.
Initial download of the metrics may take a while.