Open Access
Fig. 3
Download original image
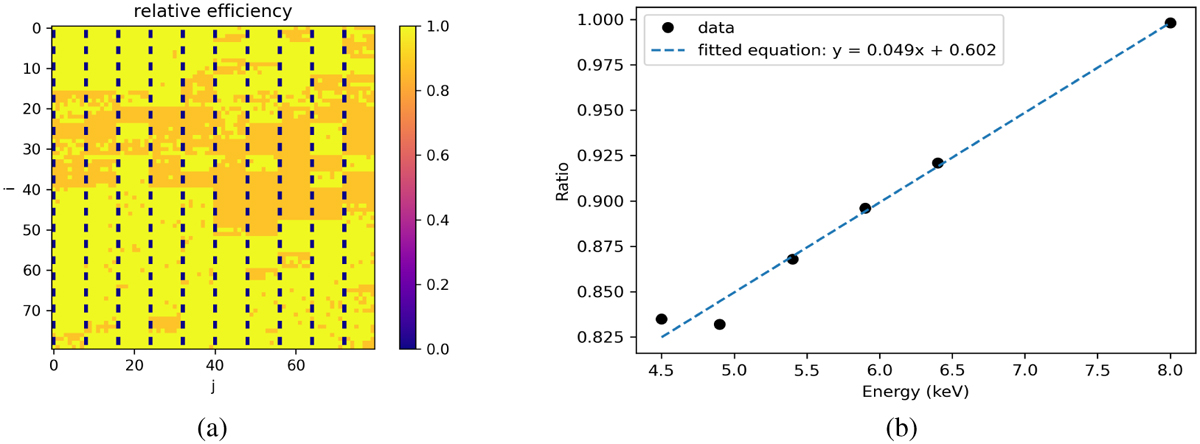
Three pixel populations found in the ECLAIRs detection plane (left: HTPs in black, LEPs in orange, and HEPs in yellow). The ratio of the mean number of relative counts between the LEP and the HEP as a function of energy is shown on the right, and it is fit with a linear function.
Current usage metrics show cumulative count of Article Views (full-text article views including HTML views, PDF and ePub downloads, according to the available data) and Abstracts Views on Vision4Press platform.
Data correspond to usage on the plateform after 2015. The current usage metrics is available 48-96 hours after online publication and is updated daily on week days.
Initial download of the metrics may take a while.