Fig. 14
Download original image
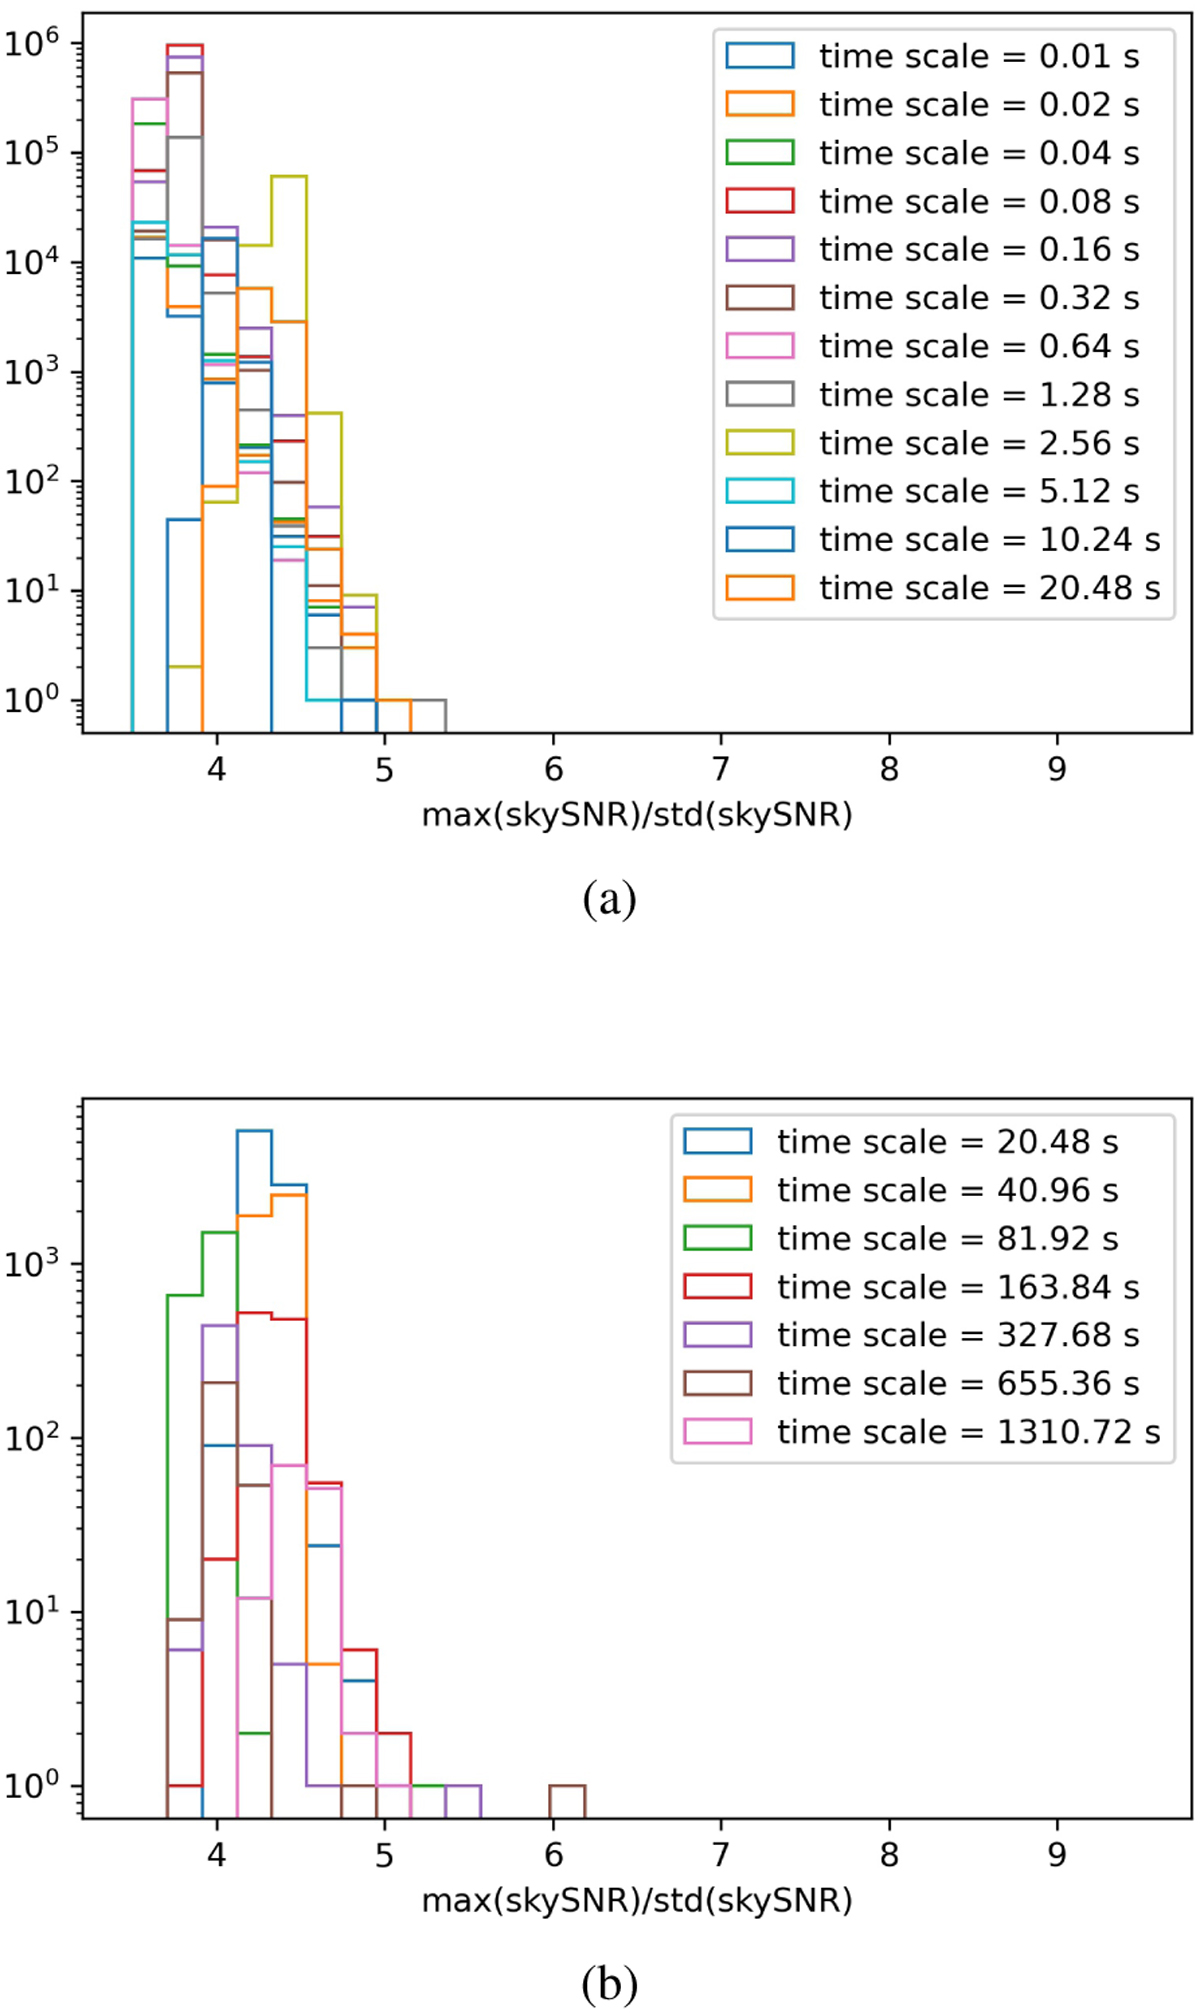
After removal of 158 heat-pipe noise pixels, panels a and b show the histograms of the max(S/N)/σS/N for different timescales in the 4–8 keV band. Panel a is used for the CRT and panel b shows the IMT. In each deconvolved S/N sky map, we selected the pixel with the maximum S/N value and computed the σS/N of the sky map. For a given timescale, the histogram shows the distribution of the ratio max(S /N)/σS/N for all-sky maps of this timescale. If max(S /N)/σS/N > 6.5, it means that there is a false trigger. Finally, no false trigger appears on any timescale after our heat-pipe noise removal procedure.
Current usage metrics show cumulative count of Article Views (full-text article views including HTML views, PDF and ePub downloads, according to the available data) and Abstracts Views on Vision4Press platform.
Data correspond to usage on the plateform after 2015. The current usage metrics is available 48-96 hours after online publication and is updated daily on week days.
Initial download of the metrics may take a while.